Custom expressions are powerful tools which can be used to set up your data the way you want it. The purpose of this overview is to introduce you to some basic concepts regarding custom expressions. What are they? How can they be used? Why do they affect the visualizations the way they do? This overview includes some examples of how to use custom expressions, and more examples can be found in the following help sections: Basic Custom Expressions, OVER in Custom Expressions, and Advanced Custom Expressions.
What are Markers?
Before creating custom expressions, it is vital to know what the markers or items in a visualization represent, since it makes it easier to understand why custom expressions behave the way they do. Particularly affected are custom expressions containing the OVER statement. See OVER in Custom Expressions to learn more.
Markers are, quite simply, a representation of how you have divided your data into different slices. A marker can represent everything from all rows in your data to a single row, depending on how you have set up your visualization. These slices can be represented by not only markers in a scatter plot, but also segments of a bar chart or a pie chart and so on.
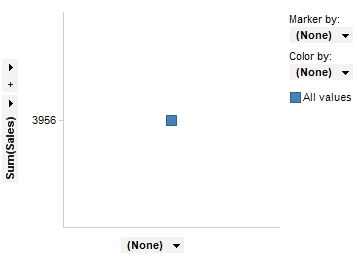
In the example below, the marker contains all rows in the data. It shows the sum of all sales of all products for all time periods.
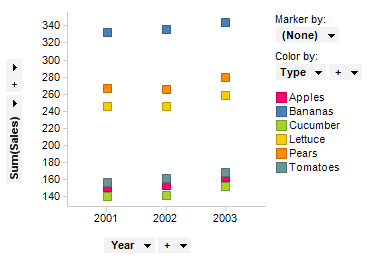
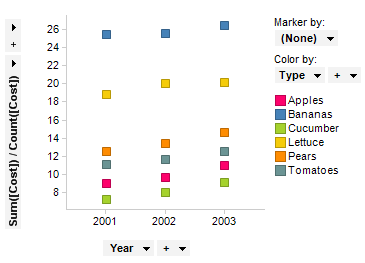
If you start slicing the data into smaller parts, the result could look like the example below, where each marker represents the sum of the sales for each product for each year.
Setting up a Visualization
Setting up a visualization is basically deciding how the data is to be divided and how the data is to be aggregated over the slices. In the examples above, the aggregation method is Sum(), which in this case means that the total value of all sales for each product and year are summed up in one marker.
The aggregation method Sum() can actually be seen as a custom expression, the only difference is that it is provided in the aggregation menu. When you want to use an aggregation method that is not listed, you can create your own using custom expressions.
When you change the visualization, for example using the filters, the markers and scales will automatically update. The aggregation will automatically be re-evaluated based on the contents of each marker. This works the same way for the provided aggregation methods as well as for the basic custom expressions.
Note: If you apply <> around an expression, it becomes categorical. Similarly, you can right-click on the axis and select Categorical Scale from the pop-up menu. If an aggregated value is made categorical, it will not change value when data are being filtered.
Example
Just to show that custom expressions and the predefined aggregations really are the same thing, consider the aggregation Avg(Cost), an aggregation that shows you the average cost for each product each year.
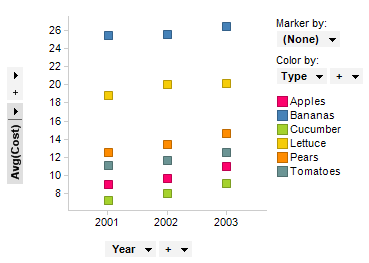
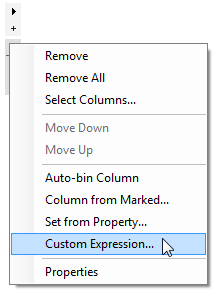
The same visualization can be created using custom expressions. Start by right-clicking on the axis selector for the Y-axis and select Custom Expression...
In the Custom Expression dialog, enter the expression Sum([Cost])/Count([Cost]), either by typing it directly in the Expression field or by inserting columns and functions from the lists, and click OK.
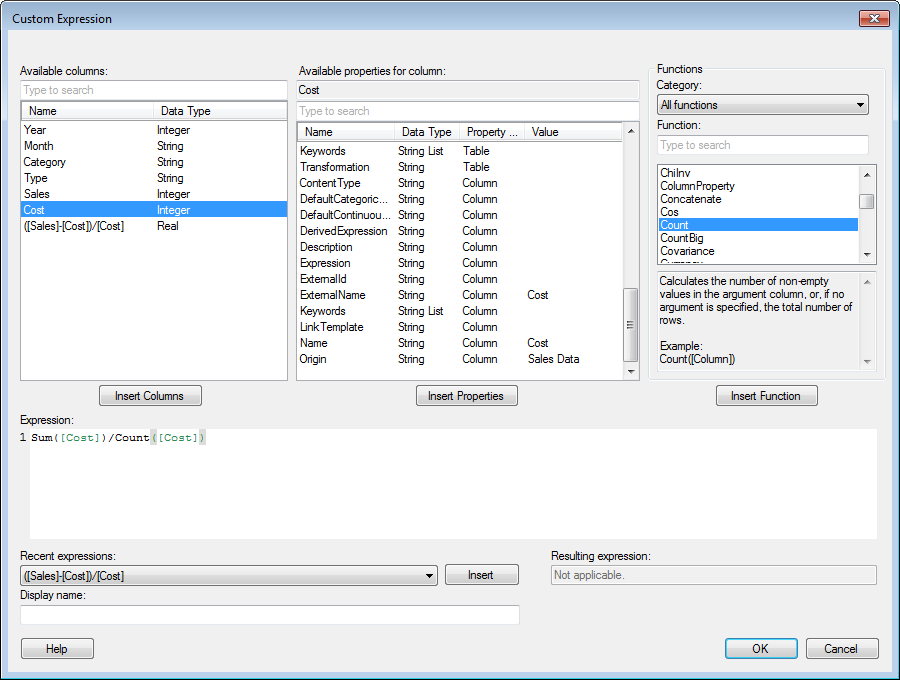
As you can see, the resulting visualization is the same as when you chose the aggregation Avg(Cost), but you have now done it yourself by creating a simple custom expression.
Note: This is just an example to show that custom expressions work the same way as the predefined aggregation methods. The main purpose with the custom expressions is to create aggregations that are not listed, rather than to recreate the predefined ones.
For more examples of custom expressions, continue to the Basic Custom Expressions page.
See also:
Custom Expressions Introduction
How to Insert a Custom Expression