Option |
Description |
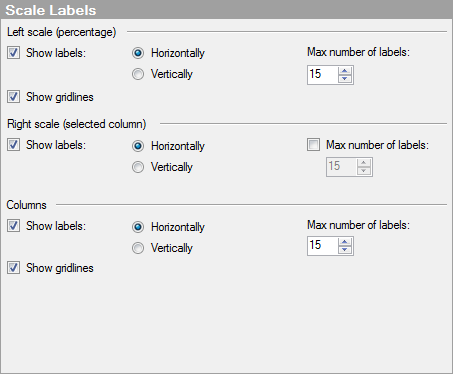
Left
scale (percentage) |
Defines the properties of the scale labels on the left Y-axis. |
Right
scale (selected column) |
Defines the properties of the scale labels on the right Y-axis. This axis shows the values of the column that has been selected by clicking on its column name on the X-axis in the visualization. |
Columns |
Defines the properties of the scale labels displaying the names of the columns included in the visualization. |
[For each scale above] |
|
Show
labels |
Specifies whether or not scale labels should be displayed on this axis. Click the radio button to display the labels Horizontally or Vertically. |
Max
number of labels |
Specifies the maximum number of scale labels to be shown on this axis. Select the check box that is available for the right scale settings if you want to specify a maximum number of scale labels to be shown. Limiting the number of labels can improve readability on an axis scale with many values. |
Show
gridlines |
Specifies whether or not gridlines should be shown for this axis. |
See also:
Parallel Coordinate Plot Properties
How to Use the Parallel Coordinate Plot
What is a Parallel Coordinate Plot?