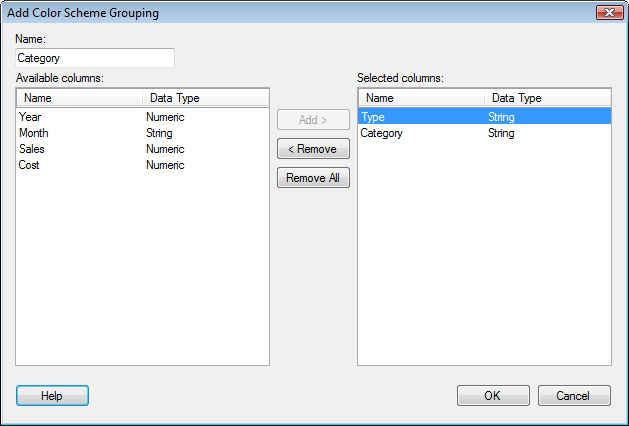
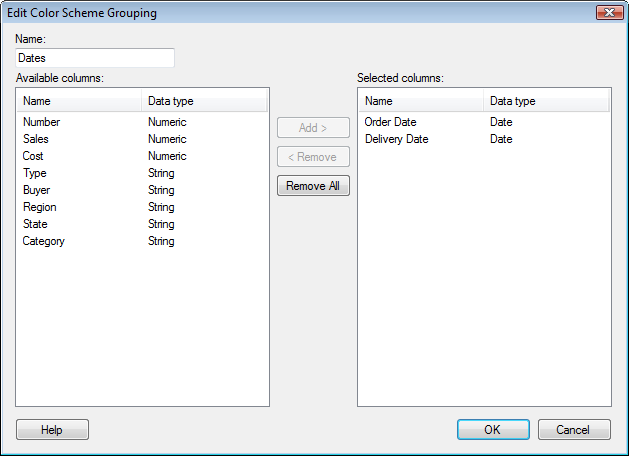
Use these dialogs when you want to add a new color scheme grouping or edit an existing one.
To reach the Add/Edit Color Scheme Grouping dialog:
In the Visualization Properties dialog for a table, a cross table, or a heat map, go to the Colors page.
To add a new grouping, open the Add menu and select Color Scheme Grouping.... To edit an existing grouping, select the grouping of interest from the list, then click on Edit.... Only groupings that you have added to the list can be edited or deleted.
Note: If this dialog is opened from a heat map or cross table, the labels will read "Available axis values" and "Selected axis values" instead. This means that in the descriptions below, each reference to a "column" should be replaced by "axis value".
Option |
Description |
Name |
Type a name to use for the color scheme grouping. |
Available columns |
Lists all columns and hierarchies available for selection. |
Selected columns |
Lists the columns selected to be used in this color scheme grouping. |
Add > |
Adds the selected columns to the Selected columns list. |
< Remove |
Removes the selected columns from the Selected columns list. |
Remove
All |
Removes all columns from the Selected columns list. |
Note: You cannot combine columns containing different data types in the same color scheme grouping. The exception being the five numeric data types: Integer, LongInteger, Real, SingleReal, and Currency, which can be added to the same grouping. The “data type” in this case is called Numeric, but is a collection of these five data types rather than an actual data type.
See also:
Coloring in Cross Tables and Heat Maps