Open the Visualization Properties dialog, and go to the Colors page.
Click on the Color Schemes
menu icon, ![]() .
.
Response: The Color Schemes menu is opened. The predefined color schemes are located in the middle of the menu, as seen below.
To facilitate setting up color schemes you can open one of the predefined ones and then adjust it according to your preferences. Predefined color schemes are only available for color schemes based on a column in continuous scale mode. Which predefined schemes are available differs slightly depending on the data type of the column.
To reach the predefined color schemes:
Open the Visualization Properties dialog, and go to the Colors page.
Click on the Color Schemes
menu icon, ![]() .
.
Response: The Color Schemes menu is opened. The predefined color schemes are located in the middle of the menu, as seen below.
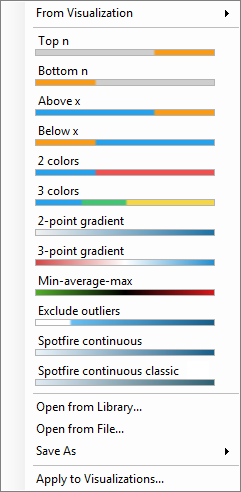
Option |
Description |
Top
n |
A color scheme in Segments color mode. Items representing values from Min to Max get a single fixed gray color, and a rule states that the ten items with the highest values in the data get an orange color. |
Bottom
n |
A color scheme in Segments color mode. Items representing values from Min to Max get a single fixed gray color, and a rule states that the ten items with the lowest values in the data get an orange color. |
Above
x |
A color scheme in Segments color mode. Items representing values from Min to Max get a single fixed blue color, and a rule states that the items representing values above average get an orange color. |
Below
x |
A color scheme in Segments color mode. Items representing values from Min to Max get a single fixed blue color, and a rule states that the items representing values below average get an orange color. |
2
colors |
A color scheme in Segments color mode. Items representing values from Min to Average get a blue color, and items representing values from average to Max get a pink color. |
3
colors |
A color scheme in Segments color mode. Items representing values from Min to Q1 get a blue color, items representing values from Q1 to Q3 get a pink color, and items representing values from Q3 to Max get a yellow color. To learn more about quartiles, see Percentiles and Quartiles. |
2-point
gradient |
A color scheme in Gradient color mode with a gradient transition from light green to dark green between Min and Max. |
3-point
gradient |
A color scheme in Gradient color mode. Items representing values from Min to 0.00 are colored with a gradient transition from red to white. Items representing values from 0.00 to Max are colored in a gradient transition from white to blue. The Min and Max points are defined with custom expressions to ensure that items representing positive values are always colored in a blue nuance, and negative values are always colored in a red nuance. |
Min-average-max |
A color scheme in Gradient color mode. Items representing values from Min to average are colored with a gradient transition from green to black. Items representing values from average to Max are colored in a gradient transition from black to red. |
Exclude
outliers |
A color scheme in Gradient color mode. Items representing values from LIF to UIF are colored with a gradient transition from light green to dark green. One rule states that items representing values greater than UIF should be white. A second rule states that items representing a lower value than LIF should also be white. To learn more about outliers, see Adjacent Values and Outliers. |
Spotfire
categorical |
The default color scheme for categorical columns. |
Spotfire
categorical classic |
The default color scheme for categorical columns used in TIBCO Spotfire 6.5 and earlier. |
Spotfire
continuous |
The default color scheme for continuous columns. |
Spotfire
continuous classic |
The default color scheme for continuous columns used in TIBCO Spotfire 6.5 and earlier. |
See also: