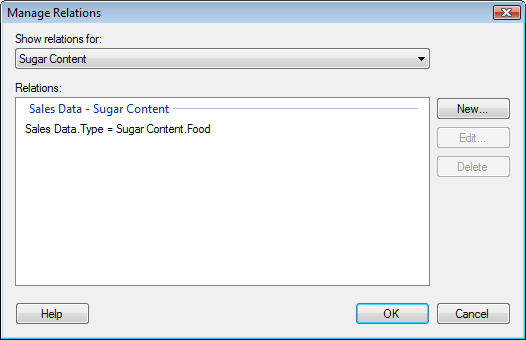
This dialog is used to manage relations between both new and previously added data tables in your analysis. When data tables have been related, they can be set up to propagate marking and filtering (see Filtering in Related Data Tables) from one data table to another. A relation between data tables is necessary if you want to set up a details visualization where the marking in one visualization allows you to drill down to details about the selected data in another visualization.
To reach the Manage Relations dialog:
Select Edit > Data Table Properties.
Go to the Relations tab.
Click on Manage Relations....
Comment: You can also reach the Manage Relations dialog from the Data page of the Map Chart Visualization Properties, or from the Add Data Tables dialog.

Option |
Description |
Show
relations for |
Select the data table whose relations you wish to view, or select All data tables to view all relations in the document. |
Relations |
Lists all relations for the selected data table or all relations in the document, depending on your selection above. Note: If one or more relations have become invalid, these will appear in red. |
New... |
Opens the New Relation dialog where you can define a new relation between two data tables. |
Edit... |
Opens the Edit Relation dialog where you can edit the relation selected in the Relations list. |
Delete |
Removes the selected relation from the Relations list. |
See also:
Details on Data Table Properties
How to Insert Multiple Data Tables to the Analysis