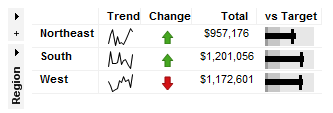
A graphical table is a summarizing visualization designed to provide a lot of information at one glance. It can be set up to show columns with dynamic items such as sparklines, calculated values, conditional icons, or bullet graphs. One value is shown for each row as specified on the Rows axis. In the example below, the graphical table shows sales performance for different regions.
You can add any number of dynamic items to a graphical table. Each dynamic item column uses its own axis expression and it can also be filtered and limited by markings separately. This way, you can show both the total values for some calculated value and the currently filtered values simultaneously. See Limiting What is Shown in Visualizations for more information.
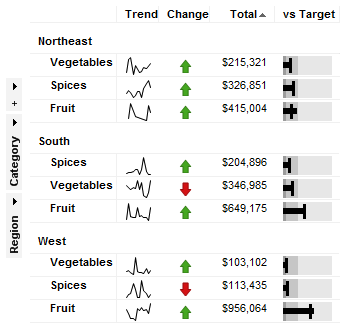
When a hierarchical structure is used on the Rows axis, the graphical table is grouped into sections and sorting can be performed within each section by clicking on a column header.
See also:
How to Use the Graphical Table