A dendrogram is a tree-structured graph used in heat maps to visualize the result of a hierarchical clustering calculation. The result of a clustering is presented either as the distance or the similarity between the clustered rows or columns depending on the selected distance measure. See Distance Measures Overview and the detailed description for each measure for further information about the available distance measures. You can perform hierarchical clustering on an existing heat map by opening the Dendrograms page of the Visualization Properties. You can also use the Hierarchical Clustering tool to cluster with a data table as the input. To learn more about hierarchical clustering and heat maps, see Overview of Hierarchical Clustering Theory and What is a Heat Map? respectively. Note that only numeric columns will be included when clustering.
Row Dendrograms
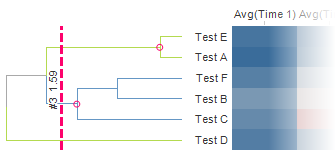
The row dendrogram shows the distance or similarity between rows and which nodes each row belongs to, as a result of clustering. An example of a row dendrogram is shown below.
The individual rows in the clustered data are represented by the right-most nodes, the leaf nodes, in the row dendrogram. Each node in the dendrogram represents a cluster of all rows that lie to the right of it in the dendrogram. The left-most node in the dendrogram is therefore a cluster that contains all rows. The vertical dotted line is the pruning line, which can be dragged sideways in the dendrogram. The values next to the pruning line indicate the number of clusters starting from the current position of the line, as well as the calculated distance or similarity at that position. In the example above, the calculated distance is 1.59, and there are three clusters starting at the position of the pruning line. The upper two, indicated by pink circles, contain two or more rows, while the lower cluster contains only one individual row.
Column Dendrograms
The column dendrogram is drawn in the same way as the row dendrogram, but shows the distance or similarity between the variables (the cell value columns).
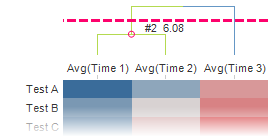
At the position of the pruning line in the above example, there are two clusters. The left-most cluster contains two columns, while the right-most cluster contains only one individual column. The calculated distance is 6.08.
Interacting with the dendrogram
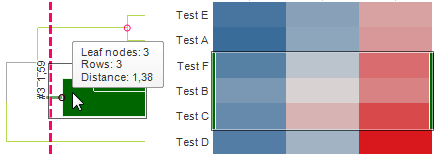
The dendrogram makes it easy to highlight and mark in the heat map. You can mouseover the dendrogram to highlight clusters and their corresponding cells in the heat map. You can click to mark a cluster. This will also mark the corresponding cells in the heat map, as in the example below. The tooltip displays information about the cluster.
Clustering
As mentioned, a dendrogram is added to the heat map when clustering is performed. A new column is also added to the data table, and made available in the filters panel. The cluster column is dynamic, and the position of the pruning line decides its content. The example below shows what the cluster column and cluster filter would look like for the row dendrogram above.
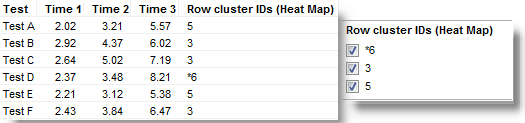
The cluster column contains unique identifiers for the cluster nodes corresponding to the position of the pruning line. In the example above, two cluster nodes are identified. Test B, Test C, and Test F belong to the cluster node with identifier 3, while Test A and Test E belong to the cluster node with identifier 5. The third identifier, *6, is a leaf node, containing Test D. The cluster column makes it possible to filter out entire clusters at a time. You can also use it to color or trellis other visualizations by.
Note: If you add a column dendrogram to a heat map that is set up with multiple cell value columns, then the cluster column cannot show any cluster IDs. This means that the cluster column cannot be used for filtering, or to color or trellis other visualizations by. Also, the column dendrogram will not be fully interactive. For instance, it may not be possible to use the dendrogram to highlight or mark in the heat map. However, you can still move the pruning line to see the calculated distance or similarity, as well as the number of clusters.
See also: