All dendrograms in TIBCO Spotfire can be represented by a data table. This makes it possible to use various clustering methods and statistical calculations, other than those included in the Edit Clustering Settings dialog. For example, you can use TIBCO Spotfire Statistics Services to execute a custom made S-PLUS or R script, which performs a clustering with a method of your choice. More specifically, you can make use of any calculation that can order leaves in a hierarchical fashion. The result from such a procedure would be a data table, which you can add to the analysis, and then import to the heat map and use for displaying a dendrogram.
You can also export a dendrogram from a heat map, view the resulting data table, make modifications, and import it back to the heat map - in effect modifying the dendrogram.
Another reason for exporting a dendrogram to a data table, and later importing it again, is performance. If you have a really large data set, and perform a clustering method on it, the calculations could take some time. If you have run a clustering method once, which is used in a dendrogram, you can export it and later import it without having to run the clustering again.
The data table representation of a dendrogram used in TIBCO Spotfire must adhere to a certain format. This format is described below.
Right-click in the visualization to display the pop-up menu.
Select Properties.
Go to the Dendrograms page.
Under Source, click the Export button.
Response: The Export Dendrogram dialog is opened.
Enter a name for the exported dendrogram data table.
Comment: Each data table must have a unique name. If a data table with the same name already exists, a number in parenthesis will be added at the end of the name. For example "My Row Dendrogram (2)".
Click OK.
Response: A data table is added to the analysis.
If you want to export this data table to use outside of TIBCO Spotfire, use the File > Export > Data... function, and select to export the data table you just created.
Select File > Add Data Tables... to add the dendrogram data table to the analysis.
Right-click in the heat map visualization to display the pop-up menu.
Select Properties.
Go to the Dendrograms page.
Under Source, select the Imported radio button.
Use the column selector to pick the data table you want to use for the dendrogram.
Comment: The data table must be formatted according to the correct specifications (see below).
Response: The imported data table is used to draw the dendrogram.
Dendrogram Data Table Format
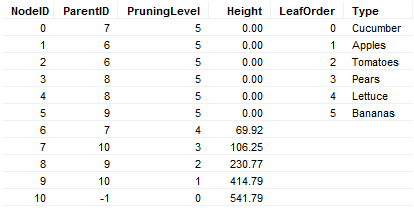
As stated above, a dendrogram can be imported and used in the heat map via a data table. This data table must follow a certain format. Most importantly, the column headers must be named exactly as seen below, and have the appropriate type:
NodeID (integer)
ParentID (integer)
PruningLevel (integer)
Height (numeric)
LeafOrder (integer)
+ one or more Leaf Identifier Columns
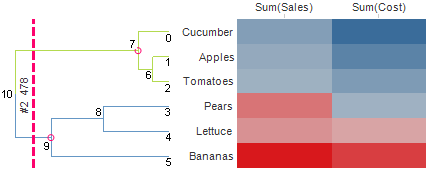
In this table, each row corresponds to a node in the dendrogram and its associated attributes. In the dendrogram below, the NodeID of each node has been indicated by a number.
NodeID
The NodeID provides a unique number for each node in the dendrogram.
ParentID
Combined with the NodeID, the ParentID determines the hierarchy of the dendrogram. For each NodeID, the corresponding ParentID states which node is its parent. For example, node 2 has the parent 6, which in turn has parent 7, which in turn has parent 10, which in turn has parent -1. Since -1 is not present in the NodeID column, that means -1 is a root node. Note that there can be several root nodes. Every unique ParentID that does not match a NodeID will be interpreted as a root node.
PruningLevel
The PruningLevel is additional information, needed to interpret prunings as cluster columns. From a PruningLevel, the system finds the associated closest node in a pruning perspective as follows: Think of all rows as branches. Prune all branches < PruningLevel. Then you will have a set of remaining nodes. Then remove all nodes whose parent is among the remaining nodes.
In the example above, this means:
Prune at level 0 -> One node (10) will be found.
Prune at level 1 -> Two nodes (7, 9) will be found.
Prune at level 2 -> Four nodes (0, 5, 6, 8) will be found.
Prune at level 3 -> Six nodes (0, 1, 2, 3, 4, 5) will be found, all leaves.
Height
The Height determines the position of the node. For a row dendrogram as in the example above, this means the horizontal position relative the edge of the heat map. In the example, all leaves have height 0, thus they begin closest to the heat map. Each parent must have an increasing value, as they come closer to the root of the dendrogram.
At first glance, the height of each node might not mean much. But there are ways of making this attribute take on more meaning. For example, by using TIBCO Spotfire Statistics Services to calculate a dendrogram, you can assign values to the height of each node, that indicates how well each node correlates to its cluster. For example, a short height could indicate that the node correlates well, whereas a longer height could indicate that the node is an outlier.
LeafOrder
Each row that is a leaf, must have a LeafOrder number. These numbers state the order of the leaves. Nodes that are not leaves have an empty value.
Additional leaf identifier column(s)
Additional columns in the dendrogram data table are leaf identifier columns. In the example above, there is only one identifier column, but it is quite possible to have several. The leaf identifier columns are used to match and sort the heat map.
Concerning R:
R is available under separate open source software license terms and is not part of TIBCO Spotfire. As such, R is not within the scope of your license for TIBCO Spotfire. R is not supported, maintained, or warranted in any way by Cloud Software Group, Inc. Download and use of R is solely at your own discretion and subject to the free open source license terms applicable to R.
See also:
Overview of Hierarchical Clustering Theory