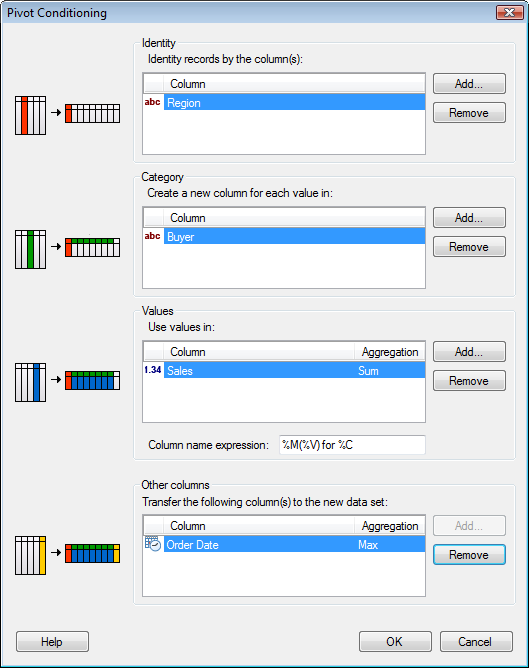

Option |
Description |
Identity |
Each unique value in the chosen identity column produces a row in the generated table. If you choose more than one column, then the new table will have a separate row for each unique combination of values in the chosen columns. |
Other columns |
Each unique value in the chosen category column produces a new column in the generated table. Selecting more than one column means that the new table will have a separate column for each unique combination of values in the chosen columns. |
Values |
The column from which the data is pulled. The values in the generated table are computed according to the method selected under Aggregation (for example, Average). Note: If you are certain that each combination of Identity and Category has a unique value, then you can select the Aggregation: None which will not apply any aggregation of the data. However, the pivot will fail if you select None, and each combination of Identify and Category is not unique. |
Column name expression |
You can select how the pivoted columns should be named. By default the predefined option is: Method(Value) for Column You can also create a custom naming scheme for your pivoted columns. |
Other columns |
This option allows you to include an overall average of a particular measurement, for each row in the generated table. |
See also: