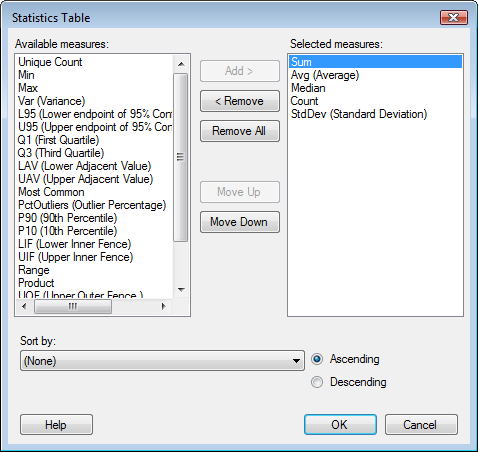
This dialog is used to specify default settings for the statistics table shown in new box plots.
To reach the Statistics Table dialog:
Select Tools > Options....
Go to the Box Plot page.
Click on Statistics Table....
Option |
Description |
Available
measures |
Lists all statistical measures which can be shown in the statistics table. |
Selected
measures |
Lists the statistical measures selected to be displayed in the statistics table. |
Add
> |
Adds the measures selected in the Available measures list to the Selected measures list. |
<
Remove |
Removes the selected statistical measures from the Selected measures list and sends them back to the Available measures list. |
Remove
All |
Removes all statistical measures from the Selected measures list. |
Move
Up |
Moves the selected measures up in the Selected measures list. The order of the measures in this list determines the order of the measures in the statistics table. |
Move
Down |
Moves the selected measures down in the Selected measures list. The order of the measures in this list determines the order of the measures in the statistics table. |
Sort
by |
Specifies the measure by which you wish to sort the rows. |
Ascending |
Sorts the measures from the lowest to the highest value. |
Descending |
Sorts the measures from the highest to the lowest value. |
See also: