Option |
Description |
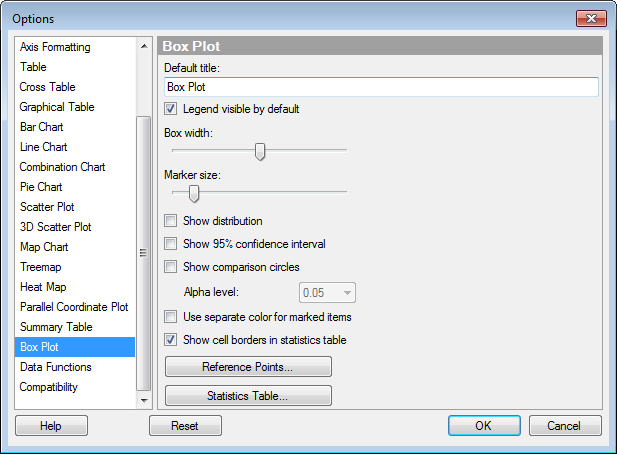
Default
title |
Specifies the default title for this visualization type. Tip: If you edit the title for a box plot and you want to use that title expression in all new box plots, then you can click on the Set as Default button in the Edit Title dialog directly. |
Legend
visible by default |
Specifies whether or not the legend should be open when creating a new box plot. |
Box
width |
Specifies the width of all box plots. |
Marker
size |
Specifies the size of all outer values. |
Show
distribution |
Specifies whether or not the distribution of values should be shown as a histogram. |
Show
95% confidence interval |
Select the check box to display the confidence interval in the box plot as a black line next to the box. |
Show
comparison circles |
Select the check box to display comparison circles in the box plot visualization. See What are Comparison Circles? for more information. |
Alpha
level |
The level at which the difference between groups would be significant. |
Use
separate color for marked items |
Select this check box to use a specified marking color (default is green) for marked items in this visualization type. If the check box is cleared, then unmarked items will be faded out instead. |
Show
cell borders in statistics table |
Specifies whether or not cell borders should be visible in the statistics table of the box plot. |
Reference
Points... |
Opens a dialog where you can specify the shape and color of the reference points to show by default in the box plot. |
Statistics
Table... |
Opens a dialog where you can specify what measures to show in the statistics table (if any), as well as the sorting to apply. |
Reset |
Resets all properties on this page to the default values. Note that an administrator can configure which settings should be default for certain user groups on the server. If you are a member of such a group, the options on this page will be set to these defaults when you press the Reset button. |
See also: