Option |
Description |
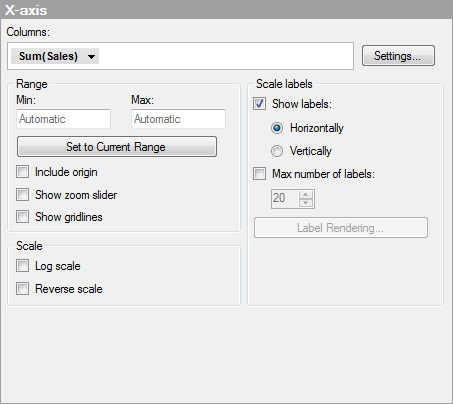
Columns |
Specifies the column or hierarchy to be displayed on the X-axis. |
Settings... |
Opens the Advanced Settings dialog, where you can change the scale mode from categorical to continuous and vice versa, as well as changing the category mode to determine which combinations to show. |
Range |
|
Min |
Determines the lower value of the axis range. Leave the field blank to automatically adjust the range to the currently lowest value in the filtered data. |
Max |
Determines the upper value of the axis range. Leave the field blank to automatically adjust the range to the currently highest value in the filtered data. |
Set
to Current Range |
Allows you to set the axis range to the currently filtered values.
|
Include
origin |
Available for continuous axes only. Always includes the coordinates (0, 0) in the visualization, regardless of filtering. |
Show
zoom slider |
Shows a zoom slider that you can manually manipulate to view only the interesting markers in the scatter plot. |
Show gridlines |
Specifies whether or not vertical gridlines should be visible. |
Scale
labels |
|
Show
labels |
Specifies whether or not scale labels should be visible. |
Horizontally |
Shows scale labels horizontally. |
Vertically |
Shows scale labels vertically. |
Max
number of labels |
Select the check box to specify a maximum number of scale labels to be shown. Limiting the number of labels can improve readability on axis scales with many values. |
Label
Rendering... |
[Only available when the selected column only can be categorical. For example, if the selected column is a string column or a binary column.] Opens the Label Rendering dialog where you can change the rendering method of the axis labels from text to images in applicable cases. |
Scale |
|
Log
scale |
Changes the scale from a linear scale to a logarithmic base 10 scale [log10 (x)]. |
Reverse
scale |
Reverses the current sort order, so that the lowest value is displayed at the top of the scale. |
See also: