
Option |
Description |
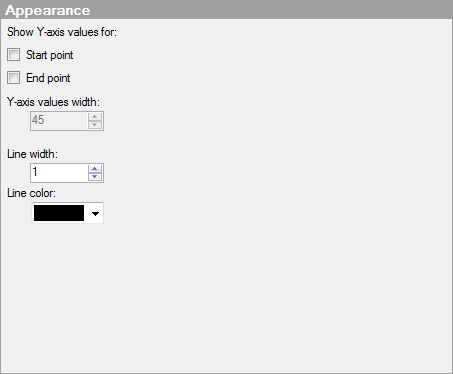
Show
Y-axis values for |
|
Start
point |
Select this check box to display the first Y-axis value for a sparkline. |
End
point |
Select this check box to display the last Y-axis value for a sparkline. |
Y-axis
values width |
[Only available when the sparkline is used in a graphical table.] Allows you to specify how many pixels of the total sparkline width to use for the start point or end point values. The total sparkline width can be controlled by dragging the column header edges with the mouse. |
Line
width |
Specifies the width of the sparklines in pixels. |
Line
color |
Specifies the color of the sparklines. |
See also:
How to Use the Graphical Table