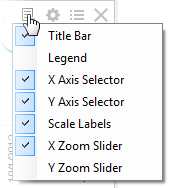
By clicking on the small arrow icon in the title bar of a visualization you can turn on or off zoom sliders for the axes in a visualization. (The icons in the title bar are only shown when hovering with the mouse pointer over the title bar area.)
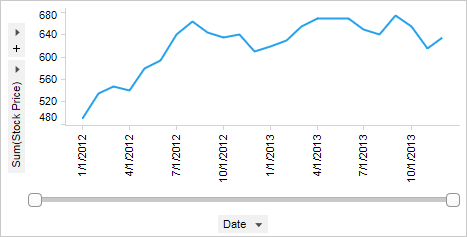
Zoom sliders are used to get a closer look at details in your visualization. The line chart below shows the stock price for a certain stock, from January 2012 to December 2013. Below the chart is a zoom slider with its handles in the end position showing the entire span of the X-axis.
Perhaps you are curious as to what happened to the stock in a narrower span of time, say from November 2012 to May 2013. By adjusting the handles of the zoom slider, the visualization is updated and zooms in on the selected span.
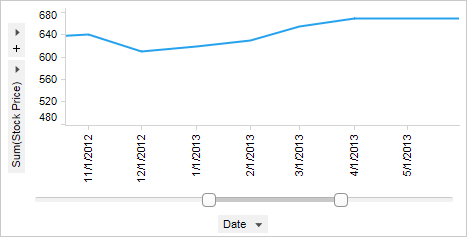
You can now grab the gray part of the zoom slider and drag it to the left or right to pan horizontally. If you like you can also turn on a zoom slider for the Y-axis.
Zoom to selection
When the zoom sliders are shown, it is also possible to press the Ctrl+Alt+Shift buttons on the keyboard and click and drag with the mouse around several items. This will automatically zoom to the selected items, without marking them.
See also: