Adding visualizations for mobile app users to see location and distances
By adding a Spotfire Text Area and a details visualization to a location-aware analysis, you can provide users with interactive tools to find the distance to any point in the data set.
About this task
Before you begin
Procedure
-
Resize the text area to contain just these two items and the title.
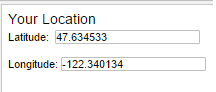
This image shows the new text area reflecting values for latitude and longitude document properties.
-
Test the visualization by selecting a data point or a range of data points on the map.
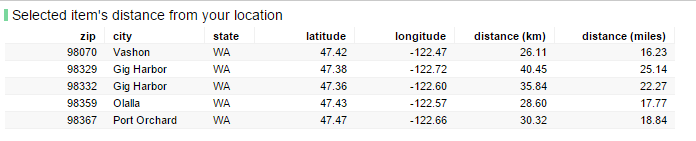
The Details Visualization shows the selected data rows, with the calculated column reflecting the distance from the latitude and longitude shown in Your Location.This image shows the result of selecting points southwest of Seattle, taken from a zip code database. They reflect the distance ("as the crow flies") in both kilometers and miles from the values set in step 6.
What to do next
Save the analysis.