KPI Library Elements
To understand creating a Key Performance Indicator (KPI) Library in TIBCO Spotfire Metrics, you must understand the elements that comprise the KPI Library.
| KPI Library Element | Description | |
|---|---|---|
| Sample Data | By default, Spotfire Metrics Modeler displays ten rows resulting from the query. | |
| Measures | The values assigned for each KPI, including the following options: comparative, KPI, supplementary, and variance. The formatting that you apply to each options is used to generate the formats for TIBCO Spotfire Metrics clients. For more options, see Measure Options. | |
| Comparative | Value to compare to the KPI value. | |
| KPI | Main or principal value. | |
| Supplementary | Supporting value that can be used in calculations. | |
| Variance | The difference between a KPI and comparative value. | |
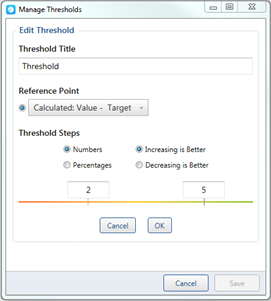
| Threshold | A threshold enables a KPI to be presented in different colors based on the variance to a comparative value. Once the reference point has been selected, the threshold is set to measure by either numbers or percentages. The color variation is determined by whether increasing or decreasing is better.
For example, in the following image, the user selected to measure by numbers, based on the target value. |
|
| Dimensions | Dimensions include the descriptive parts of a KPI (for example, geography, business, and segment). You can assign levels to enable the following.
KPI Trend dimension enables data to be trended for a KPI. Typically, trended data in data/time-based data to present a historic data trend. To define the dimensions, see Choose Columns. |
|
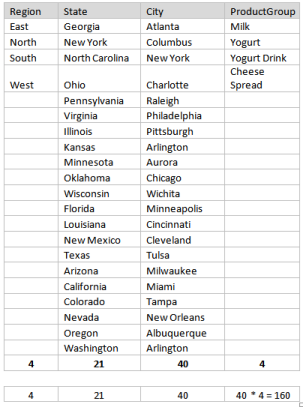
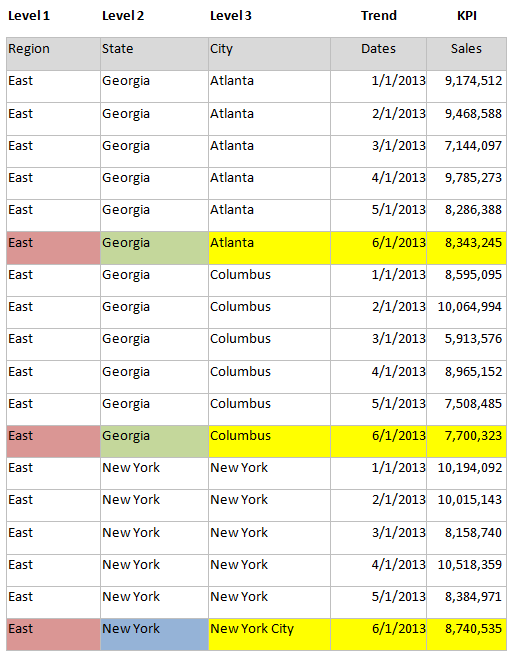
| Levels | Levels enable drilldown and roll up of parent and child KPIs.
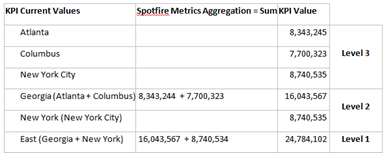
In the following table, Region->State-City is a 1:1 relationship, i.e. State and City have only a single parent, Region. ProductGroup has multiple parents, as it is at level 4. The number of child KPIs is the multiple of Cities and ProductGroups. In the following table, there are highlighted rows. In the next table, these rows will be aggregated to create even more KPIs. In the following table, you can see how the KPI values of combined cities and levels created even more KPIs for drilldown. |
|
| Owner | Each column can be mapped to a specific dimension level. The owner alias in the query must match the user alias in Spotfire Metrics. It is not necessary to map all the dimension levels with owners. KPI Owner information is included as part of the KPI Definition and is displayed in Spotfire Metrics once it has been published as a feed. | |
| Trend | If a column is selected as a trend, the data for a KPI is automatically sorted based on the selected trend value. | |
| Column Title | The title of the column as it appears in the data source. This text populates the column title in the dimensions element, where you can edit the display without altering the data. | |
| Filter | If a column is selected as a filter, Spotfire Metrics Modeler creates the relationship between the hierarchies, enabling users to navigate the KPI Set when they are viewing the KPIs in the TIBCO Spotfire Metrics client. For example, a district manager in Georgia could select a number of filters including state, region, and city. Then the district manager can drill down to view metrics on all three of his stores in Atlanta. | |