Using hierarchy filters
A hierarchy filter represents the data in a hierarchy. The filter consists of an expandable tree view, where the categories within the different levels of the hierarchy are represented by check boxes.
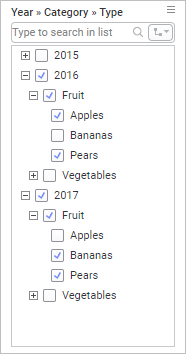
Only rows containing values with selected check boxes remain in the visualization. For example, rows containing 2016, Fruit, and Apples are included in the visualization, but rows containing 2017, Fruit, and Apples are not included in the visualizations.
How to create a hierarchy filter is described in Creating hierarchies.
Procedure
Copyright © Cloud Software Group, Inc. All rights reserved.