Trellis options
A visualization that is trellised is split into a number of panels, where each panel represents a subset of the data. Using trellised visualizations, you can spot similarities and differences between these subsets.
When creating a trellised visualization using the drop targets, you can arrange the trellis panels in either only rows or in only columns, alternatively as a matrix:
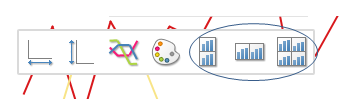
These layout options can also be accessed in the Trellis section of the Properties popover for the visualization. From there, you have more options to arrange the trellis panels:
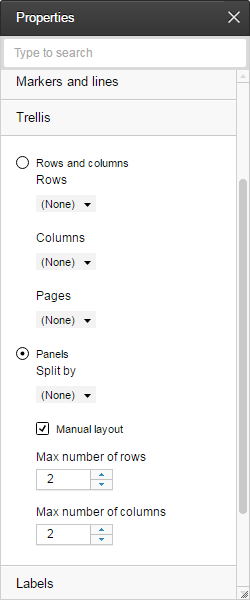
For example, you can, using the Rows and columns option, split the data further by selecting different columns in the Rows and Columns drop-down lists.
By selecting a column in the Pages drop-down list, the different trellis panels in the visualization are treated as "pages" within the visualization. Only one trellis panel is visible at a time. Then you use a scroll bar to view the other panel "pages".
In case you want the layout of a trellis matrix to be different, you can customize it. Via the Manual layout check box in the Panels option, you specify the wanted maximum number of rows and columns in the matrix.