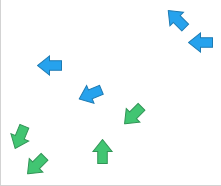
Showing directions using marker rotation in a scatter plot

Some marker shapes, for example arrows, indicate directions. If you in a scatter plot rotate such markers, you can visualize directions of motions. What you need is a column that contains values that can be interpreted as degrees.


Rotated markers in a scatter plot

The rotation of the markers can be made clockwise or counter-clockwise. A full rotation is 360 degrees, and a value of 361 is interpreted as 1 degree.

Procedure

  1. Right-click the scatter plot, and select Properties in the opened menu.
    The Properties popover is displayed.
  2. In the popover, select Shape.
    The Shape section is displayed.
  3. Select Fixed shape, and in the shape palette, click a marker suitable for showing direction.
  4. In the popover, select Rotation.
    The Rotation section is displayed.
  5. Select the column and, if applicable, which type of aggregated value to use for defining how many degrees the markers should be rotated.
  6. Select rotation direction; Clockwise or Counter-clockwise.

Result

The markers in the scatter plot are rotated to indicate different directions.