Showing customized intermediate total bars
The intermediate total bars in a waterfall chart usually summarize categories at certain levels in a hierarchically organized data. However, you can customize which categories an intermediate total bar should represent.
The example below illustrates how this can be done using
grouping categories.
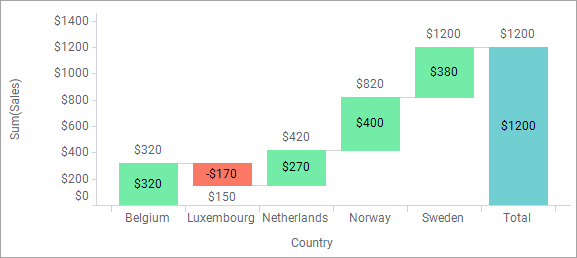
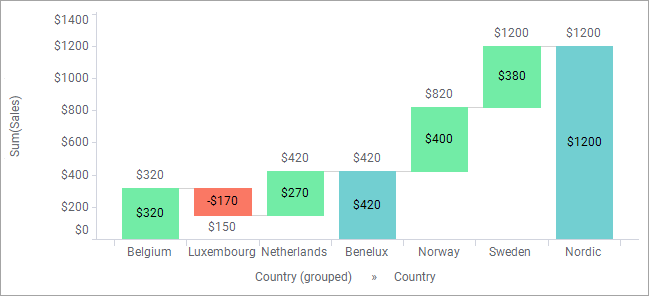
The waterfall chart shows sales figures for a number of countries. Assume you want to show one intermediate total for the Benelux countries (Belgium, Netherlands, and Luxembourg), and one intermediate total for the Nordic countries (Norway and Sweden), but still be able to view the contribution from each of these countries.
Procedure
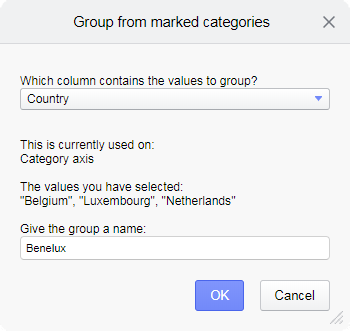
- Type a name of the new group, Benelux, and click OK.
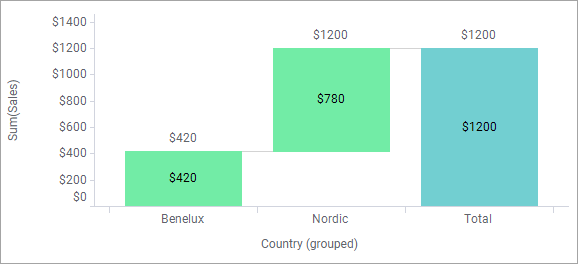
- In the same way as described above, group Norway and Sweden into a Nordic value.
- Using the new data column, create a hierarchy on the category axis as shown below.
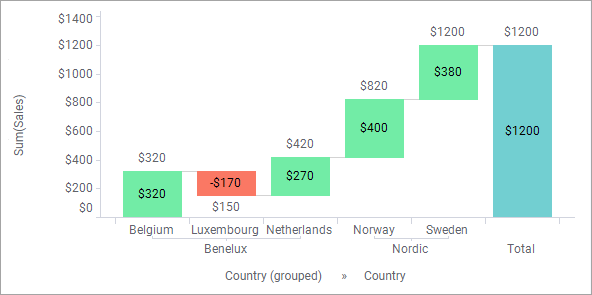
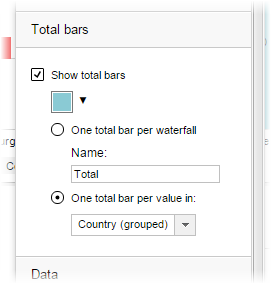
- Right-click the waterfall chart, and in the opened Properties dialog, click Total bars.
- Select One total bar per value in, and make sure Country (grouped) is selected in the drop-down list.
Copyright © Cloud Software Group, Inc. All rights reserved.