Make calculations on the data
There are many ways to make calculations on the data.
Aggregations and expressions
The most typical calculations that are made in the visualizations are the aggregations (for example, sum, average, max, and median), which you specify on various visualization axes to summarize the data:
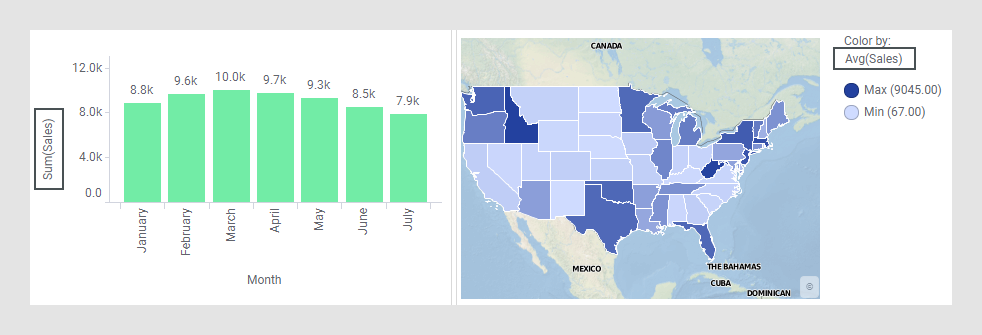
However, calculations on the data can be done in other ways and at different places in an analysis to get more out of your data.
First of all, if any of the predefined aggregations does not match the calculation you want to do, you can create your own expressions to apply on the various axes in a visualization as exemplified below.
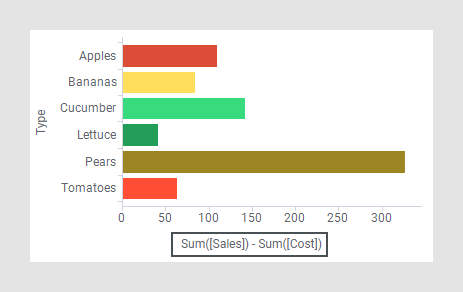
Moreover, you can create expressions whose resulting values are added as a new column in a data table.
Expressions, predefined as well as new expressions, can be applied not only on the ordinary axes that are used for setting up a visualization. You can also use them, for example, to add error bars or to create subsets.