You can zoom into visualization details by marking data of interest and view solely the marked data within the visualization.
Procedure
-
Right-click the visualization, and select
Properties in the opened menu.
The
Properties pop-over is displayed.
-
Click
Data.
The
Data section is displayed.
-
Below
Limit data using markings, select the check box representing the visualization's own marking (the marking that is selected in the
Marking drop-down list).
-
Make sure
All data is selected in the drop-down list
If no items are marked in the master visualization, show.
Now you can mark data in the visualization, and the visualization will adapt to show solely the marked data. To return to the original visualization, simply click an empty visualization area.
Example
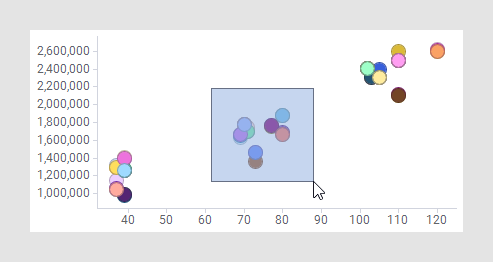
Assume you want to take a closer look at the group of markers in the middle part of the scatter plot below. Follow the steps above, and mark the data of interest.
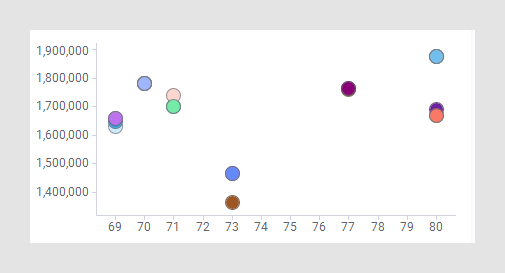
These steps let you zoom into this particular data as shown below.
Copyright © Cloud Software Group, Inc. All rights reserved.