Drilling down into details

If you want to drill down into specific data in a visualization, you can create a details visualization of a suitable type and configure it to your needs. In the master visualization, you mark the data that you want detailed information about, and in the created details visualization, solely the currently marked data will be displayed.

Note: Details visualizations can be used to drill down into your data in multiple steps. The marking you perform in one visualization determines what you will see in the next visualization, and so on.

The map chart below is used to illustrate. The markers represent the total sum of sales at two different stores after the first six months of 2017. However, the data table, which the map chart is based on, contains more information, so it is possible to drill down into details. Assume, for example, you are interested in displaying the monthly sales at the Boston store.


Details visualization image 1

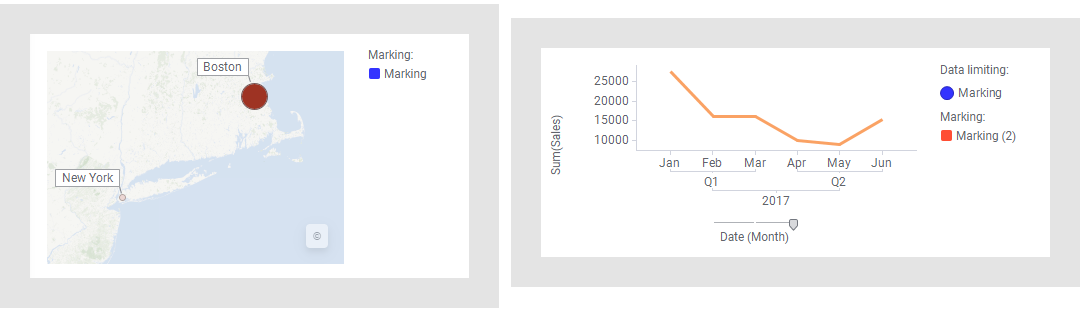
This can be done by creating a details visualization. The line chart below is such a visualization, but any visualization type can be created. By marking the Boston marker in the map chart (the master visualization in this example), the monthly sums for the Boston store are displayed in the line chart.
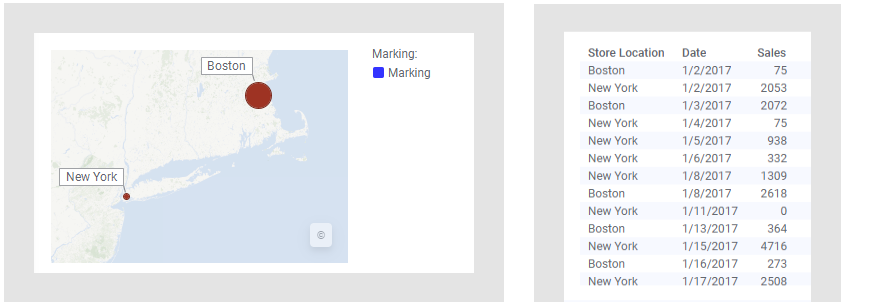

Details visualization image 2

Note: The Data limiting setting in the legend states that the data in the created details visualization is limited. The line chart above displays only data that is marked in the map chart using this particular marking. Furthermore, a new marking becomes available in the details visualization. This marking will be used to limit the data, if you drill down deeper into the data.
Tip: It is also possible to view marked data within the master visualization itself. See Zooming into visualization details.

Prerequisites

The master visualization, that is, the visualization whose details you want to drill down into, is created.

Procedure

  1. Mark the items, which you want to base the details visualization on.
  2. Right-click the visualization, select Create details visualization and the visualization type to use as details visualization.
    A suggestion of the selected visualization type is presented. It is based on the marked data only.
  3. Adjust the details visualization according to your needs. For information on how to adjust visualizations, see Creating a visualization.
    Note: You can specify what the details visualization should show, when no data is marked.

If you want to drill down deeper and deeper into your data, you can create consecutive details visualizations.

  1. Repeat steps 1-3 with the details visualization as starting point.