Adding an image layer

With an image layer, you can configure your map chart to use images in combination with both geographical and non-geographical data. For example, you can add a background image and position markers on top of the image.

Procedure

  1. Right-click the map chart visualization, and from the menu, click Properties.
    The Properties popover is displayed, with the Map chart popover showing the current layers, in their layer order, top to bottom.
  2. Click Add new layer at the bottom of the Map chart list.
    A list of the layer options is displayed.
  3. From the list, click Image layer.
    The image layer is added to the Map chart layer list, and the Properties for the layer is displayed.
  4. In the Image section, click Browse.
  5. Navigate to the image you want to use, and add it to your map chart.
    The image is loaded.
    Note: Sometimes the image you have selected does not contain geographical metadata. In those cases a dialog might appear, informing you that the coordinate reference system must be 'None' in all parts of the map chart visualization if you are going to use the image as a background. Click Yes if you want to use the image as a backgound. The coordinate reference system will then be set to 'None' right away. Click No if the image should not be used as a background image. See Moving and resizing images for examples where non-geographical images are not used as backgrounds in maps.
  6. Optionally, drag and drop the layer to a new position on the list.
    Tip: You can reuse the settings of an already existing layer. Select Duplicate layer in the Properties popover to duplicate either the selected layer in the same map chart, or to add a copy of a layer from another map chart in the analysis. See Duplicating a layer for detailed instructions.

Image layer examples

Using a background image works similarly to the map with markers, but with the difference that you do not need to have map data in a data table in order to set it up. If you use a GeoTIFF image, where geographical information is included as metadata in the image file, then the image will automatically be positioned correctly. The example below shows a GeoTIFF image that is projected onto a map layer, and the markers are placed on top of the image layer.

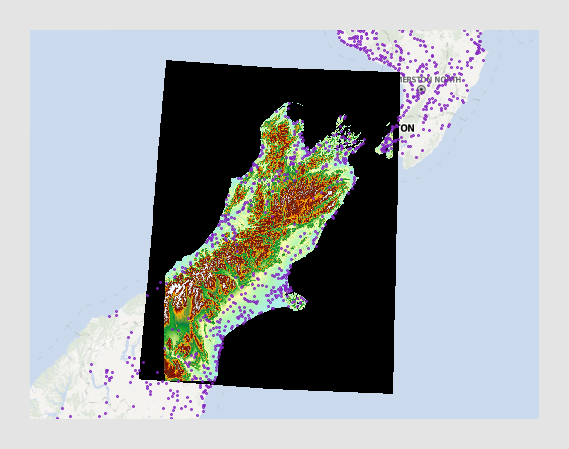
Note that for the GeoTIFF image to be placed correctly on the map, the image must include projection metadata, and that some projections are not supported.

With other types of image files, the data table must contain X and Y coordinates for the markers to be placed correctly in geographical positions.

A map chart can also be used to show non-geographical data. The example below shows a map chart where the background is an image illustrating the three weather types sunny, partly cloudy, and rainy. The markers placed on top of the image show how many days in the month of August that were sunny, partly cloudy, and rainy respectively.

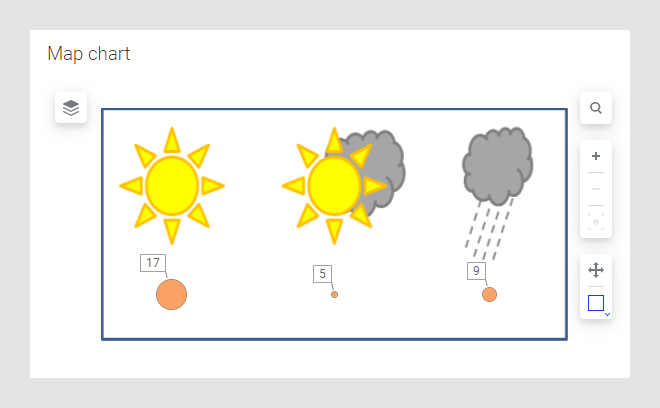
See Positioning markers on an image background to learn more about this example.