Displaying grand totals for columns in cross tables
You can display a grand total for each column in the cross table. A grand total is by default calculated using the same expression that is used for calculating the cell values. For example, a grand total can indicate a 'grand sum' or a 'grand average'.
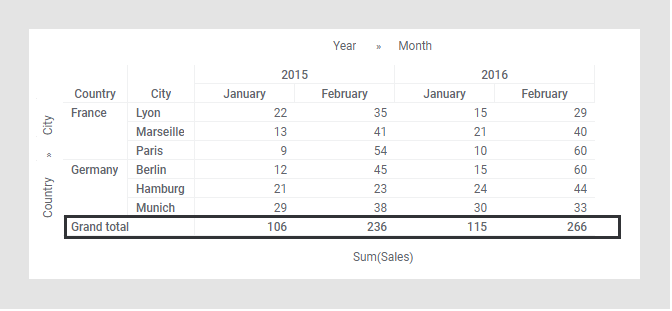
In the cross table below, the aggregation method 'Sum' is used to aggregate the 'Sales' values, and accordingly, the Grand totals are also calculated as a 'Sum'.
Totals are not based on the aggregated values shown in the cross table cells; they are by default based on the underlying data table rows. For example, if 'Average' is used as aggregation method, the Grand total average of a column takes into account all the data rows on which the cell values are based, and not only the averages shown in the cross table cells. See Displaying totals.
Note: There is, however, an
option to base a total on the already aggregated cell values in the cross table. If you use this option, the total will be calculated as the sum of the cell values, no matter expression used for the calculations of the cell values.
Procedure
Copyright © Cloud Software Group, Inc. All rights reserved.