Displaying totals
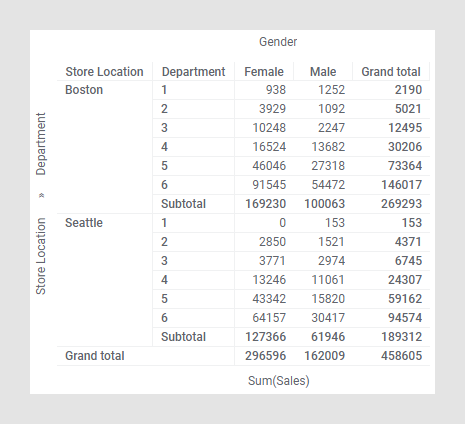
You can display grand totals for columns as well as rows in a cross table. If the vertical axis is hierarchically structured, it is possible to display also column subtotals for different levels in the hierarchy.
Totals are calculated using the same aggregation or expression as is used for calculating the cell values. The calculation is not based on the aggregated values shown in the cross table cells; it is by default based on the underlying data table rows. For example, if 'Average' is used as aggregation method for the cell values, the grand total average of the column is not the average of the cell values; it is the average of all the underlying data rows. This is exemplified below, where a simple data table is visualized by a cross table:
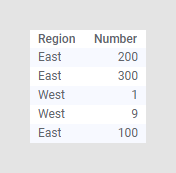
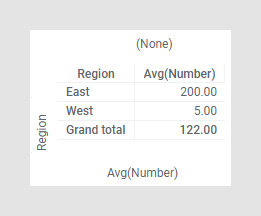
The expression used for calculating the cell values is average (Avg). The Grand total is calculated on the underlying rows ((200+300+1+9+100)/5=122), and not on the cell values.
- Displaying grand totals for columns in cross tables
You can display a grand total for each column in the cross table. A grand total is by default calculated using the same expression that is used for calculating the cell values. For example, a grand total can indicate a 'grand sum' or a 'grand average'. - Displaying grand totals for rows in cross tables
You can display grand totals for each row in the cross table. Grand totals are by default calculated using the same expression that is used for calculating the cell values. For example, a grand total can indicate a 'grand sum' or a 'grand average'. - Showing subtotals in cross table columns
If the vertical axis in a cross table is structured hierarchically, it is possible to show subtotals within the cross table columns. A subtotal is by default calculated using the expression that is used for calculating the cell values. - Displaying grand totals and subtotals as sums of the cell values
By default, grand totals and subtotals in a cross table are calculated using the same aggregation or expression that is used for calculation of the cell values, and the calculations are based on the underlying data table rows. However, it is possible to base the totals calculations on the aggregated cell values. Then totals will be calculated as the sum of the cell values, no matter expression used for the cell values.