The user interface
The most vital parts of the user interface are shown below.
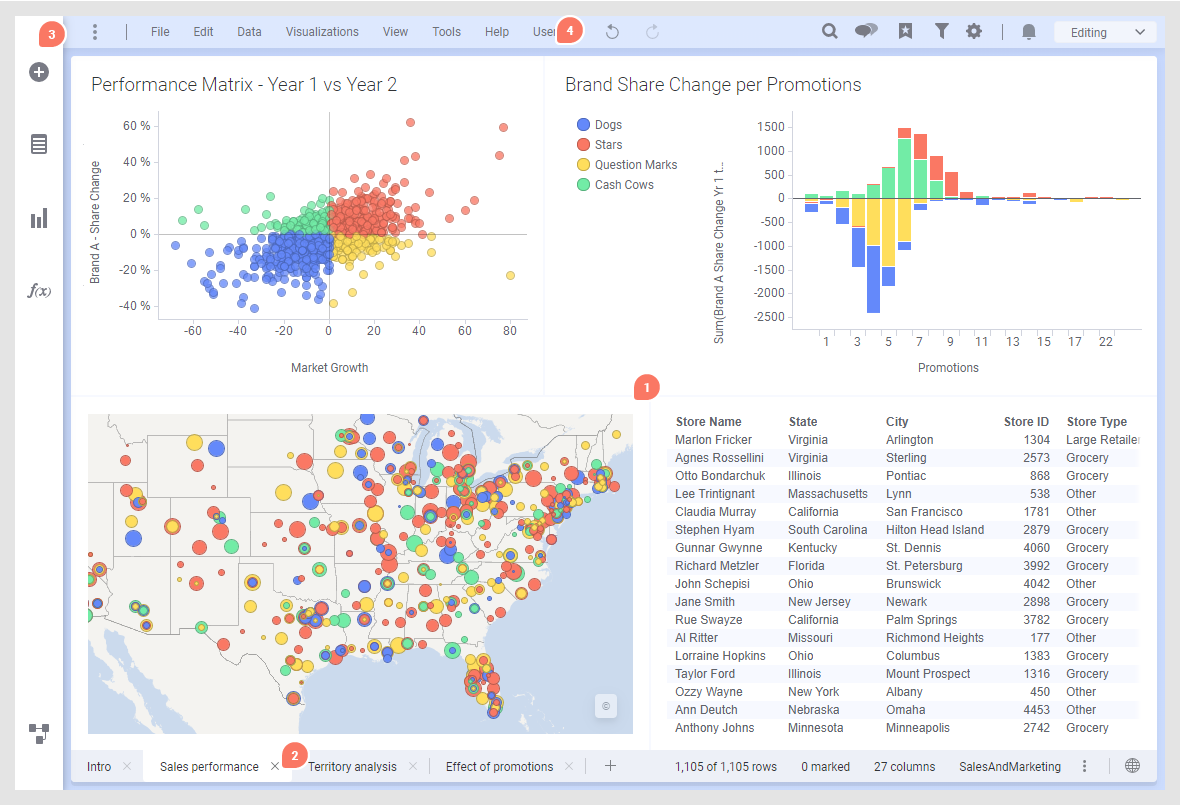
1. Visualizations
An analysis consists of visualizations based on the loaded data. To provide the best representation of your data, many visualization types are available. Within each visualization type, you can use various properties to reflect different dimensions of the data, for example, color, size, and shape.
2. Pages
The visualizations are organized onto pages in the analysis. You can resize and move around the visualizations on the pages to get the desired layout.
3. Authoring bar
You access the most frequently used features for authors by clicking the icons on the authoring bar. It is only shown when in Editing mode.
- Files and
data
 : Here you add the data you want to visualize, or
open existing analyses.
: Here you add the data you want to visualize, or
open existing analyses.
- Data in
analysis
 : Lets you create
visualizations by selecting the data you are interested in first, and then you
let Spotfire recommend various ways to visualize it. This is also where you can
get more information about the data and filter out values.
: Lets you create
visualizations by selecting the data you are interested in first, and then you
let Spotfire recommend various ways to visualize it. This is also where you can
get more information about the data and filter out values.
- Visualization
types
 : Here you create
visualizations by selecting the type of visualization you want to use. Then you
configure the visualization your way.
: Here you create
visualizations by selecting the type of visualization you want to use. Then you
configure the visualization your way.
- f(x) – analytic
tools
 : If enabled, gives you
easy access to your favorite data functions, which can perform different
calculations.
: If enabled, gives you
easy access to your favorite data functions, which can perform different
calculations.
- Data
canvas
 : Here you get a view of the data structure in the
analysis, and you can also make changes to it. You can, for example, add more
rows and columns to data tables, and specify when and how the data should be
loaded and stored.
: Here you get a view of the data structure in the
analysis, and you can also make changes to it. You can, for example, add more
rows and columns to data tables, and specify when and how the data should be
loaded and stored.
4. Menu bar
In the left part on the menu bar, features mentioned in the authoring bar above are accessible, but you can also get access to other important features, for example, export and calculation options, and the user's guide. In addition to the menus, buttons for Undo and Redo are available.

If you want, you can click the three dots furthest to the left to turn on and off this part of the menu.
To the right on the menu bar, you can use Find
 as a short way to find contents as well as actions and
features you are looking for. This part of the toolbar is also where you are
given information, various notifications, and scheduled updates details, and
you can open the collaboration, bookmarks, and filters panels, and settings for
the visualization properties. You can
customize this part of the toolbar by selecting shortcuts
to actions and tools that you use often.
as a short way to find contents as well as actions and
features you are looking for. This part of the toolbar is also where you are
given information, various notifications, and scheduled updates details, and
you can open the collaboration, bookmarks, and filters panels, and settings for
the visualization properties. You can
customize this part of the toolbar by selecting shortcuts
to actions and tools that you use often.

If you are authoring analyses to be consumed by users who do not have authoring rights, you get their view of the analysis by switching from Editing to Viewing in the drop-down list.