Area Properties
The quickest way to modify area properties (e.g., patterns, colors, etc.) is to right-click on the area you want to modify, and select Pattern from the shortcut menu to display the Area Properties dialog box. Use these options to change the area color, pattern, and style in the graph. The default patterns, colors, and modes of display of consecutive plots and other components of the graphs are determined by the selections on the Documents/Graphs: Display tab of the Options dialog box (accessible from the Tools menu). Note that the Area Properties dialog box can also be accessed in the Plot: General tab of the Graph Options dialog box. Once you have made all the desired changes, click Close.
- Area pattern
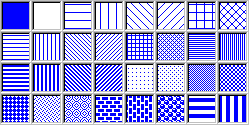
- Select a pattern for the marker with this option. The following patterns are available in this dialog box:
- Foreground color, Background color
- You can select a different color for the area Foreground (i.e., the main component or the "outside" of the item) and Background (the "inside" of the item) with these options. When you click on the combo box arrow, a list of colors will be displayed from which you can select the desired color. If you select More colors from the list of colors, the Color Palette dialog will be displayed. Here, you will be able to select a single color to be added to the list of colors. To use a transparent background (or foreground), click the Transparent background (or Transparent) button. Click the Automatic background to use the Windows system color. You can also select from a variety of prespecified color styles, by clicking the Style name option.
Area style. Instead of specifying area patterns and color using the options described above, you can select the style you want to use for the area from the Style drop-down list. To view a menu of options related to styles (save, save as, revert to saved, etc.), click the
 button to the right of this list box. For more information on styles, see
Graphics Styles.
button to the right of this list box. For more information on styles, see
Graphics Styles.