QC Charts Example 8: Specifying Charts for Individual Observations and Moving Ranges
- Overview
- In this example you will learn how to create control charts for individual observations. These types of charts can be used when individual observations instead of sample averages should be plotted. However, since no samples with multiple observations are available, you cannot estimate the process sigma from within-sample ranges or standard deviations, but have to revert to the concept of moving ranges. We will use the same data file (Cover.sta) as in the first example and monitor variable Width. For further explanations, see Example 1: Specifying Control Charts for Variables, Process Capability. Unlike the first example, we will ignore the sample size information and pretend that each individual observation constitutes a separate sample. Technically, we are assuming a sample size of one.
- Specifying the Analysis
- Open the data file Cover.sta via the File - Open Examples menu; it is in the Datasets folder. Select Quality Control Charts from the Statistics - Industrial Statistics & Six Sigma submenu or from the Data Mining - Process Optimization - QC Charts submenu to display the
Quality Control Charts Startup Panel. Then select Individuals & moving range on the
Quick tab (or the
Variables tab). Click the
Real-time tab and select the Auto-update option button. Now click the OK button to display the
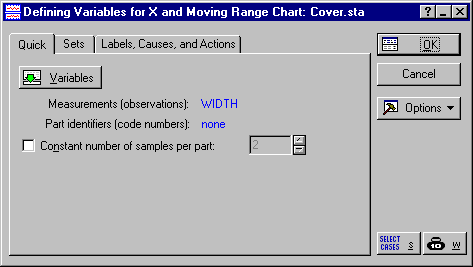
Defining Variables for X and moving range dialog.
In this dialog, specify for which variable the chart should be created. Because we want to create the chart for variable Width, click the Variables button and select Width as the Variable with measurements. Note that no option for specifying sample sizes is needed for this dialog.
Click OK to produce the chart.
Reviewing the Chart.
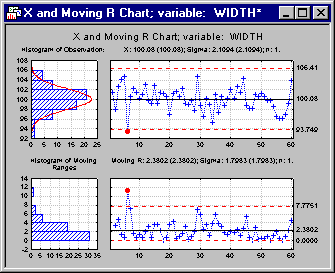
Clearly, sample 6 seems to indicate an out-of-control condition, since the point for sample 6 crosses the control limits in both charts (X and MR). We may be able to find an assignable cause for this particular sample, label the cause and some action that was taken to fix the problem, and exclude the point from the computation of the control chart parameters (see also Example 2: Brushing, Assigning Causes and Actions).
Note: the chart for individual observations and moving ranges assumes independent observations that are serially uncorrelated. Whenever serial correlation occurs (the individual measurements are heavily influenced by previous values) you should not apply this type of control chart directly to the original measurements. However, you can use time series techniques (such as ARIMA) in order to model a stochastic process and apply the control chart to the residuals of that process.See also QC Chart Examples.


