Advanced Example 7: Cross-Validation
STATISTICA GLM offers extensive options for analyzing and graphing predicted and residual values (see description of the Resids tab; see also, Tests of assumptions, residual statistics, and graphs). Further, the model that is fit for the analysis sample can also be applied to compute 1) predicted values for cases or subjects in prediction samples with unknown values on the dependent variables, and 2) the adequacy of the model for explaining responses for cases or subjects in cross-validation samples with known values on the dependent variables.
One easy way to compare the adequacy of the model for explaining responses in the analysis and cross-validation samples is to examine the plot of observed versus predicted values for each sample. For this example, use the Exp.sta example data file.
Ribbon bar. Select the Home tab. In the File group, click the Open arrow and select Open Examples to display the Open a STATISTICA Data File dialog box. The Exp.sta data file is located in the Datasets folder. Then, select the Statistics tab. In the Advanced/Multivariate group, click Advanced Models and from the menu, select General Linear to display the General Linear Models (GLM) Startup Panel.
Classic menus. On the File menu, select Open Examples to display the Open a STATISTICA Data File dialog box. The Exp.sta data file is located in the Datasets folder. Next, from the Statistics - Advanced Linear/Nonlinear Models submenu, select General Linear Models to display the General Linear Models (GLM) Startup Panel.
Select General linear models as the Type of analysis and Quick specs dialog as the Specification method. Click the OK button to display the GLM General linear models Quick Specs dialog box.
On the Quick tab, click the Variables button to display a standard variable selection dialog box. Specify Stress_R as the Dependent variable and Correct1 as the single Continuous pred. variable. Click the OK button.
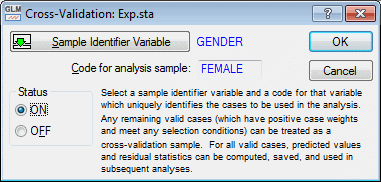
Select the Options tab. Click the Cross-validation button to display the Cross-Validation dialog box. Click the Sampler Identifier Variable button and select Gender in the standard variable selection dialog box that is displayed. Click the OK button to return to the Cross-Validation dialog box, and then double-click in the Code for analysis sample box. In the resulting dialog, select Female, and then click the OK button. Finally, in the Status group box, select the ON option button.
Click the OK button in the Cross-Validation dialog, and click the OK button in the GLM General linear models Quick Specs dialog box to display the GLM Results dialog box..
- Results
- Select the
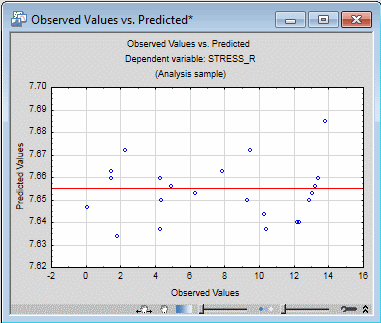
Resids tab. Click the Obs. & pred. button. There is a significant negative relationship between Correct1 and Stress_R scores when Females are used for the analysis sample. Accordingly, there is a fairly strong relationship between observed and predicted Stress_R scores for Females when Correct1 is used as a single continuous predictor variable.
Now, let's view the same plot for the Males. First, click the Modify button to return to the GLM General linear models Quick Specs dialog box. On the Options tab, click the Cross-validation button to display the Cross-Validation dialog box. Double-click in the Code for analysis sample box and then double-click on Male in the resulting dialog box. At this point, Male should be displayed in the Code for analysis sample box. Click the OK button in both the Cross-Validation dialog box and in the GLM General linear models Quick Specs dialog box to return to the Results dialog box.
Once again, on the Resids tab, click the Obs. & pred. button. The same plot for Males shows no discernible relationship between observed and predicted values.
Clearly the model found for predicting Stress_R for Females did not cross-validate well for Males.
See also GLM - Index.


