Example 9: Testing for Stability of a Correlation Matrix over Time
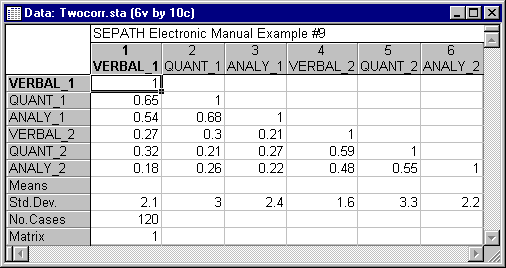
Suppose you measure a set of variables twice, and want to test the hypothesis that the correlation coefficient has not changed from time 1 to time 2. For example, suppose 120 individuals are measured twice on verbal, quantitative, and analytical ability. In this case, the covariance matrix would be 6x6.
A 6x6 correlation matrix is given in the Twocorr.sta data file.
Select Structural Equation Modeling from the Statistics - Advanced Linear\Nonlinear Models menu. In the resulting Structural Equation Modeling dialog click on the Advanced tab.
Here, we modify the general approach to setting up a pattern hypothesis described above in order to compare correlations measured at two times.
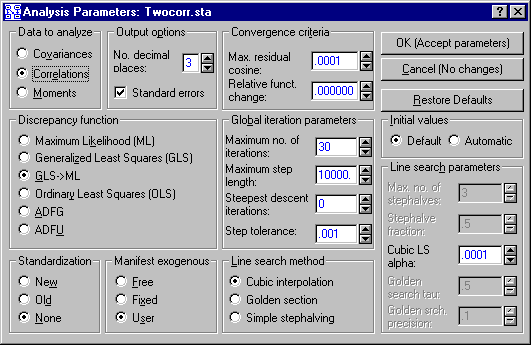
(1) Click the Set parameters button and select Correlations under Data to Analyze in the resulting of the Analysis Parameters dialog and click OK..
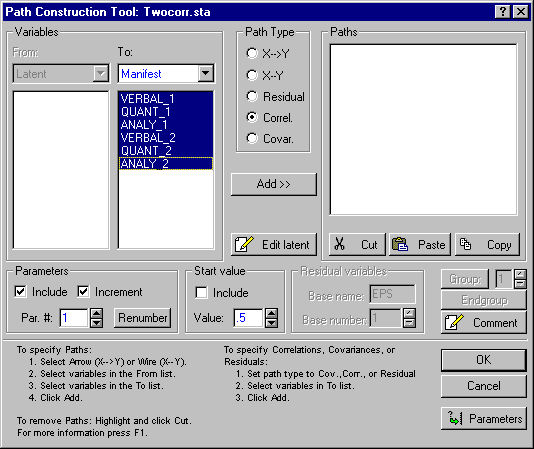
(2) Click the Path Tool button to display the Path Construction Tool dialog. This is used to create all the paths for a correlation matrix for the relevant variables. Select Correl. under Path Type, then highlight all 6 of the manifest variables in the To: column.
(3) Next, click the Add>> button. This action creates all the paths for the full correlation matrix for the 6 variables.
(4) You want to constrain the correlations between the variables at time two to be the same as those at time 1. Notice first that there are 3 correlations between the 3 variables at time 1, and they are assigned parameter numbers 1-3. Highlight the corresponding 3 correlations at time 2 by clicking on them while holding down the CTRL key.
(5) Set the Renumber box to renumber these 3 correlations starting at 1.
(6) Next, highlight all the paths and renumber them, starting at 1.
(7) Click OK.
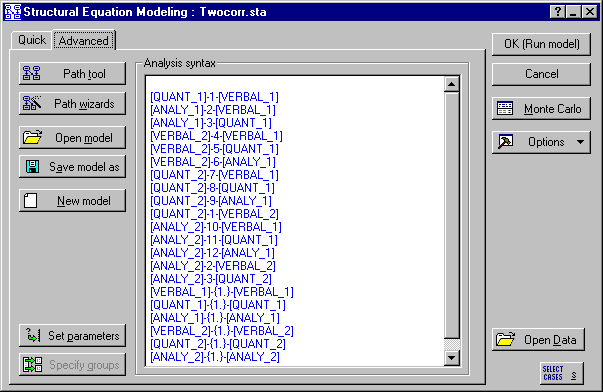
Your final model should look like this.
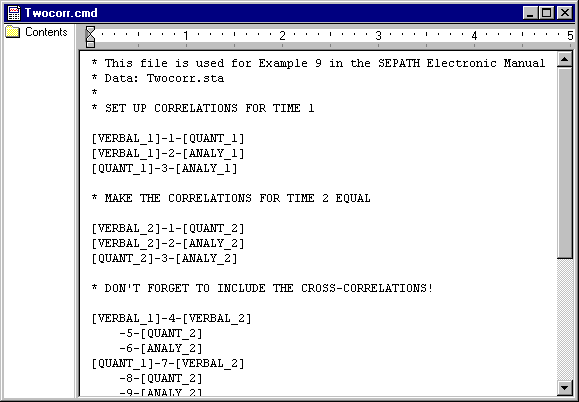
The commands for performing the hypothesis test are in a file called Twocorr.cmd (/Examples/Datasets/SEPATH directory of STATISTICA). Part of this file is shown below in report format. (You can run this model by clicking the Open model button on the Advanced tab of the Structural Equation Modeling dialog, choosing this file, and clicking the OK (Run model) button.) The estimated correlations among the alias latent variables are maximum likelihood estimates of the correlations among the manifest variables, under the null hypothesis.
A note of caution should be added here. The tests performed by SEPATH on correlation matrices are valid asymptotic statistics. However, the very limited evidence available at this time suggests that (especially at smaller sample sizes) tests especially designed for correlational hypotheses (Steiger 1980a, 1980b; Steiger & Browne, 1984; Steiger & Hakstian, 1982; Wilson & Martin, 1983), which use the Fisher transform, may be somewhat more accurate and more powerful than tests performed with SEPATH.

