How can I identify specific subsets of data in a graph?
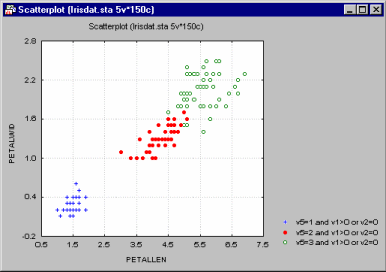
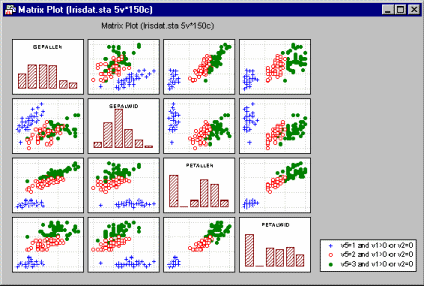
Graphs menu graphs offer facilities to define subsets of cases to be identified in graphs. User-defined "multiple-subset" definitions of such subsets can be entered as logical case selection conditions of virtually unlimited complexity using facilities identical to those illustrated in producing categorized graphs.
These subset identification facilities are supported in many types of Graphs menu graphs, including matrix plots,
icon plots,
2D scatterplots, 3D scatterplots, 3D trace plots and other graphs.
Subsets can also be identified on the Extended tab of the Brushing dialog box. This facility offers a wide variety of methods to identify subsets of data (which can be considered a "command driven" brushing). In this dialog, you can select ranges of values for the variables in the plot and examine their relations to other variables (for example, in a matrix plot; note that the layout of this dialog is somewhat different depending on the current type of graph).


