Conceptual Overviews - Surface Plots
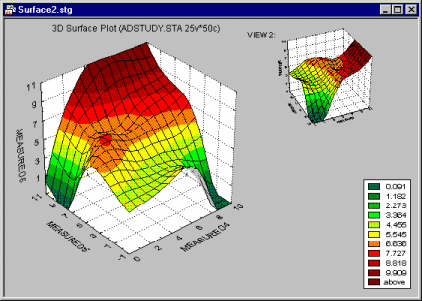
In the 3D Surface plot, a surface function will be fitted to a 3D scatterplot. As in the 3D Scatterplot, this is commonly done in order to reveal hidden patterns of data and detect the relationships among the three variables in the plot.
STATISTICA offers several types of surface functions that can be fit to the data and smoothing methods that can be applied. They range from the simple linear surface function to functions that will "smooth" the data and approximate a surface at a given level of stiffness (e.g., distance-weighted least squares, negative exponential smoothing, etc.). Those more complex surface-fitting methods can be particularly useful in order to uncover complex (interactive), non-linear, and non-monotonous relationships between the variables.
Options to customize the appearance of the wirenet, levels of shading, color palette, etc. are available in the Graph Options dialog, accessible by double-clicking on the graph background or by selecting Graph Options from the Format menu.
The Nonlinear Estimation module
The surface fitting (and data smoothing) facilities accessible from the graphics dialogs and described below offer a selection of predefined, general-purpose exploratory procedures; you can also plot (overlay) a custom-defined function by entering a function equation (see below).
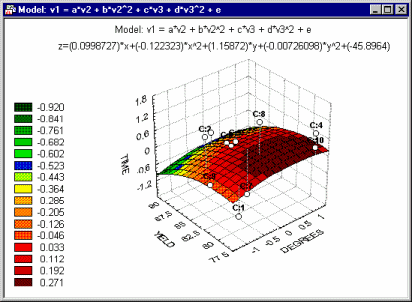
In order to fit user-defined functions to data, use Nonlinear Estimation, which offers comprehensive facilities to fit functions of practically unlimited complexity (including piecewise models).
A wide selection of different function minimization algorithms is provided, predefined or user-defined loss functions can be used, and the results can be explored via interactive surface plotting options (to visually examine the closeness of the fit).
Applications
Surface plots can be used in exploratory data analyses such as those illustrated in 3D scatterplots. Also, they are useful to visualize results from analyses, such as custom function fitting (via Nonlinear Estimation) or Cluster Analysis.
A common application of the surface plot in the context of industrial statistics is to visualize the results of central composite design experiments (see Experimental Design). There, specific systematic values of two (or more) variables are set by the experimenter to evaluate the effect of those variables on some dependent variable of interest (e.g., strength of a synthetic fabric).
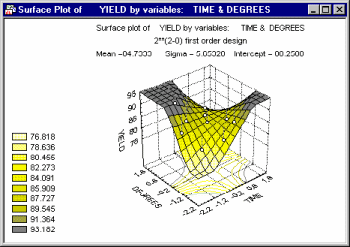
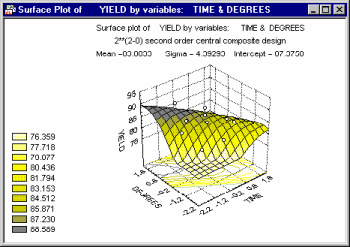
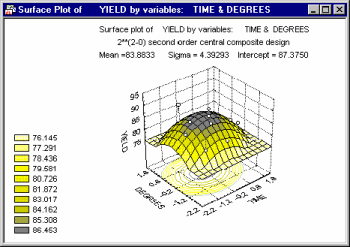
In many cases, complex non-linear relationships between variables emerge in such experiments.
Rotation
It is often useful to rotate the surface plot in order to reveal its characteristics (e.g., specific peaks and valleys) more clearly or examine the hidden sides.
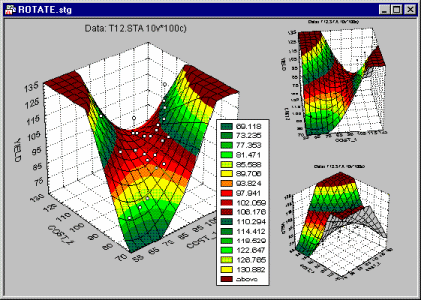
The rotation (and perspective) facilities for three-dimensional graphs are described in Point of View.