Conceptual Overviews - 3D Scatterplots
3D Scatterplots (also called XYZ Scatterplots) represent the most elementary form of 3D data plots. Its most typical application is to visualize relations between continuous variables.
Although there may be specific reasons for using 3D Scatterplots for particular applications, one of the major general advantages of this type of plot is that it can reveal complex interactive relations between the represented variables.
Applications
- Exploring interactive relations between variables
- Consider the following illustrative example. Imagine that the price and supply of a commodity were registered over a period of time (at different times of the day). Plotting the values of those three variables (Price, Supply, and Hour of the day) may reveal a complex multivariate interactive relationship that would be almost impossible to identify in a numerical exploratory data analysis.
For example, it could be revealed that the strength of the relationship increases in the second half of the day (i.e., the later the hour, the closer the price is related to supply); however, the shape of the plot may also show that this relationship does not hold when the supply is very low (i.e., for low values of the variable Supply).
It is often easier to reveal such complex interactive relations using graphical as compared to numerical methods, especially when the relationships involved are curvilinear.
- Identifying clusters and subsets in samples from non-homogenous populations
- Another area of exploratory data analysis where XYZ scatterplots can be useful is when it is expected that there are distinctive clusters of observations that can be identified by examining the distribution of observations (simultaneously) on three or more variables.
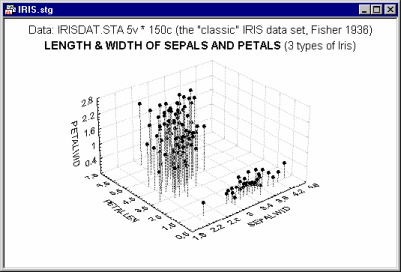
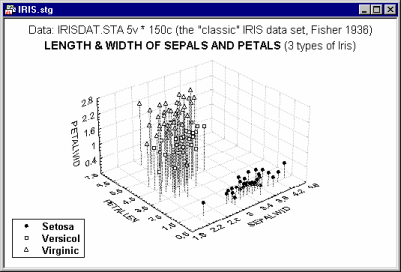
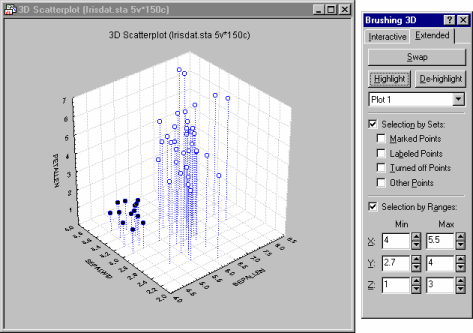
For example, the following XYZ Scatterplot shows data from the "classic" iris data set (Fisher, 1936; file Irisdat.sta); the observations represent different types of iris.
The graph shows that by plotting the width of petals against the length of petals and width of sepals, you can see that the sample is not homogenous.
You can easily identify the distinctive types of iris in the graph above, where the subsets are marked using the multiple subsets facility.
- Examining results from exploratory multivariate analyses
- In statistics, XYZ scatterplots are often used to visualize results of multivariate exploratory techniques, such as factor analysis and multidimensional scaling.
For example, plotting labeled cases in three-dimensional space created by a three-dimensional solution of multidimensional scaling can aid in the interpretation of the dimensions, as well as classification of individual cases.
For more information, see also the discussions on Factor Analysis and Multidimensional Scaling.
Rotation
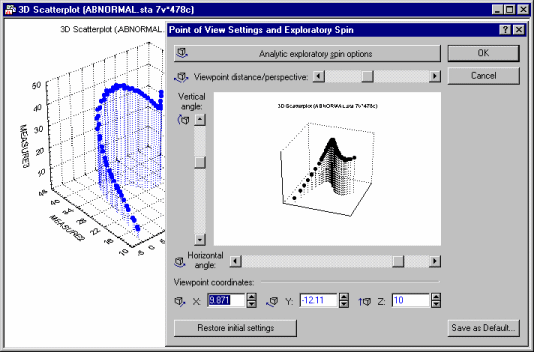
One of the common problems when examining 3D Scatterplots is overlapping points, which decrease the readability of the graph. In some cases when the number of observations is very large, the graph is almost impossible to understand if you look at it from only one viewpoint. Thus, interactive on-screen rotation is particularly useful in the exploration of 3D scatterplots, as illustrated below.
The rotation (and perspective) facilities for three-dimensional graphs are described in the Graph: Point of View (3D XYZ Graphs) topic.
- Exploration of data via 3D spinning
- By clicking the Spin button, the display can be set into continuous rotation in clockwise or counter-clockwise directions.
- Brushing
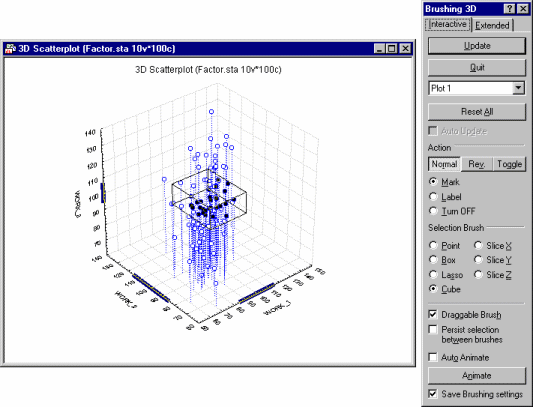
- In addition to the regular (2D) brushing, Statistica also supports "true 3D" subset selection. This can be accomplished in two ways: interactively using a unique set of tools to make precise selections of subsets in 3D displays using the simple mouse movements,
and using the Extended tab of the Brushing 3D dialog box, which contains options to Highlight (or De-highlight or Swap the highlight attribute) points by specifying the value range coordinates of selected variables, or by reference to attributes of previously selected points.
In XYZ scatterplots, the selection of ranges by values will refer to the X, Y, and Z coordinates of the data point values. For more information on brushing, see the following FAQ topics: Can I interactively review points that belong to specific plots in multiple scatterplots and other multiple graphs?, How can I use the slices brush?, Is there a glossary of brushing terms?, and What is animated brushing?.

