Example 5: Gage Linearity and Bias Study
Starting the Analysis. Open the example data file GageLinearity.sta, and start the Statistica Gage Linearity analysis. Following are instructions to do this from the ribbon bar and from the classic menus.
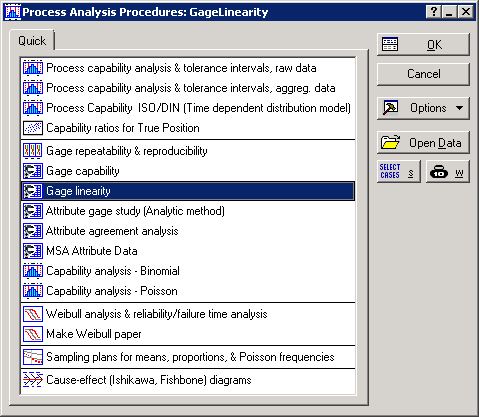
Ribbon bar. Select the Home tab. In the File group, click the Open arrow and select Open Examples to display the Open a Statistica Data File dialog. Double-click the Datasets folder, and then open the data set. Next, select the Statistics tab. In the Industrial Statistics group, click Process Analysis to display the Process Analysis Procedures Startup Panel.
Classic menus. Open the data file by selecting Open Examples from the File menu to display the Open a Statistica Data File dialog. The data file is located in the Datasets folder. Then, from the Statistics - Industrial Statistics & Six Sigma submenu, select Process Analysis to display the Process Analysis Procedures Startup Panel.
Select Gage linearity.
Click the OK button to display the Gage Linearity dialog.
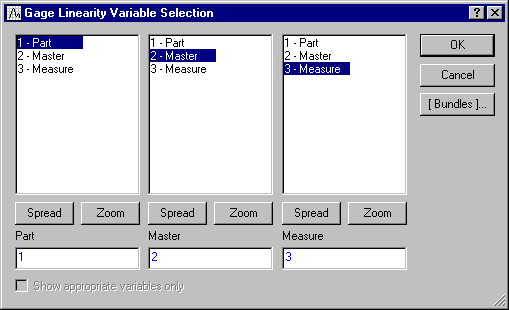
Click the Variables button to display a standard Statistica variable selection dialog. Select Part as the Part variable, Master as the Master (reference) variable, and Measure as the Measure variable.
Click OK to close this dialog and return to the Gage Linearity dialog.
NOTE: If your data set contains aggregated results, select the Aggregated data check box on the Gage Linearity dialog before selecting the variables. Clicking the Variables button will then display a four variable selection dialog, which is used to specify variables as described above. In this case, however, you will need to select a Count variable, which is used for determining the frequency of measurements with identical outcomes for a particular part.
The Process variation option on the Gage Linearity dialog is used to specify the value of process variation obtained from a previous Gage R&R or process tolerance study (see AIAG). This value will later be used in the Results dialog for calculating the percentage of gage linearity and bias. You can leave this option blank if no estimate of process variation is available, but for this example, enter 5 in the Process variation box.
You can also choose to use the Select Cases option to create conditions for which cases will be included (or excluded) in the current analysis. Further information on how to use this standard Statistica option can be obtained from the documentation for Analysis/Graph Case Selection Conditions. More information is available in the case selection conditions overview, syntax summary, and dialog description. Also, you can use the W (weights) option to adjust the contribution of individual cases to the outcome of the current analysis by "weighting" those cases in proportion to the values of a selected variable. Both options, Select Cases and W, are also available in the Process Analysis Procedures Startup Panel.
To continue with this example, having selected the variables and specified the process variation, you are now ready to start running the analysis. Click the OK button to run the Gage Linearity analysis and display the Results dialog, where you can produce various outputs in the form of spreadsheets and graphs to analyze the results and draw conclusions.
Reviewing the Results
The first thing you will probably notice is the information at the top of the Gage Linearity Results dialog, which provides you with a review of the analysis results. Among these, you can review the absolute and percentage values of linearity and bias, and the regression and ANOVA tables, which you can use for assessing the quality of the regression model you just built.
Using the options on the Results dialog, you can review various outcomes of your analysis in greater detail, which you can save in the form of Statistica Spreadsheets or Graphs.
Click the All Tables button to generate a spreadsheet containing all the information you need for analyzing the linearity and bias of the problem as well as a complete set of regression statistics and ANOVA tables. These include:
- Gage Linearity & Bias
- Consists of estimates of the absolute and percentage value of linearity and bias. This part of the spreadsheet is available only if a value for the Process variation was provided on the Gage Linearity dialog.
- Regression Statistics
- The regression table provides you with certain measures such as R2, adjusted R2, regression standard error and the number of valid cases found in the data set (i.e., number of observations). You can use R2 (also known as coefficient of determination) to assess how well the regression model fits the data. For better models, this quantity tends to approach unity. For more details on how to interpret these quantities, see Gage Linearity Technical Notes.
- Regression Table
- The regression table displays the estimates of the slope and intercept (constant) of the linear model which uniquely determines the regression problem. In addition, it also provides the standard error associated with the estimates of the model coefficients and their corresponding t-statistics and p-value. For more details on how to interpret these quantities, see Gage Linearity Technical Notes.
- ANOVA Table
- This part of the spreadsheet provides you with analysis of variance for the regression model. In particular, it displays estimates of the variability in the model, which can be decomposed into variability due the regression model and variability due to noise (unexplained variability). For further discussion of the ANOVA technique, see Gage Linearity Technical Notes.
- Bias Significance Table
- This is the last table displayed in the gage linearity and bias spreadsheet. It contains, for each part, the master readings, the average of the measurements, and the corresponding bias. Note that in measuring the percentage of bias you have the choice of selecting whether to base the estimate of the standard deviation on the sample range or sample standard deviation. You can make your choice by selecting the appropriate option in the Method for calculating standard deviation group box in the Results dialog.
- Graphs
- In addition to generating the above spreadsheet,
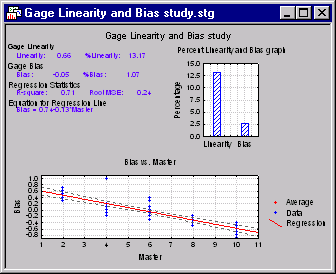
Statistica Gage Linearity provides you with options to plot the linear regression graph for visual inspection of the quality of fit, as well as the histogram of the percentage of linearity and bias. You can generate these plots in a single graph window by clicking the
Multiple graphs button.
Alternatively, you can produce individual graphs separately using the options Bias v/s master regression graph and Percent linearity bias graph.


