SANN Example 5: Cluster Analysis in SANN
The term cluster analysis actually encompasses a number of different classification algorithms that can be used to develop taxonomies (typically as part of exploratory data analysis).
For example, biologists have to organize the different species of animals before a meaningful description of the differences between animals is possible. According to the modern system employed in biology, man belongs to the primates, the mammals, the amniotes, the vertebrates, and the animals. In this classification, the higher the level of aggregation the less similar are the members in the respective class. Man has more in common with all other primates (example, apes) than it does with the more distant members of the mammals (example, dogs).
In Statistica Automated Neural Networks (SANN) Cluster Analysis, Kohonen training is used to determine the underlying clusters in the data. Kohonen training is an algorithm that assigns cluster centers to a radial layer by iteratively submitting training patterns to the network, and adjusting the winning (nearest) radial unit center, and its neighbors, toward the training pattern. These Kohonen networks are also known as self-organizing feature maps (SOFM).
Data
You can use the classic IRIS data set. IrisSNN.sta contains information about three different types of Iris flowers - Iris Versicol, Iris Virginic, and Iris Setosa. The data set contains measurements of four variables (sepal length and width, and petal length and width). The cases are arranged so that the first case 50 cases belong to Setosa, while cases 51-100 belong to Versicol, and the rest belong to Virginic. In addition, the data is well clustered with Setosa being well separated from Versicol and Virginic, while there is a small amount of overlap between Versicol and Virginic. This last property makes the data set particularly suitable for cluster analysis.

Specifying the analysis
You can open the IrisSNN.sta data file and start SANN in the following two ways:
- Ribbon bar. Select the Home tab. In the File group, click the Open arrow and select Open Examples to display the Open a Statistica Data File dialog box. Open the data file, which is located in the Datasets folder. Then, select the Statistics tab. In the Advanced/Multivariate group, click Neural Nets to display the SANN - New Analysis/Deployment Startup Panel. Or, select the Data Mining tab. In the Learning group, click Neural Networks to display the SANN - New Analysis/Deployment Startup Panel.
- Classic menus. From the File menu, select Open Examples. In the Open a Statistica Data File dialog, double-click the Datasets folder, and then double-click IrisSNN.sta. Then, from the Statistics menu or the Data Mining menu, select Automated Neural Networks to display the SANN - New Analysis/Deployment Startup Panel.
- In the New analysis list box, select Cluster analysis, and then click the OK button to display the SANN - Data selection dialog box.
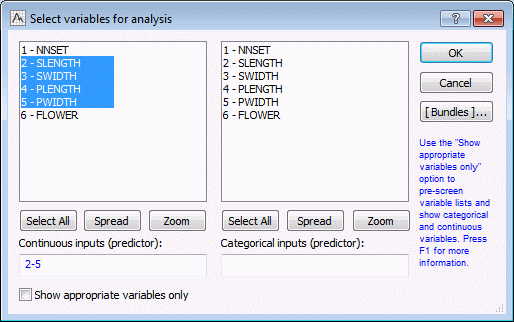
- On the Quick tab, click the Variables button to display a standard variable selection dialog box. In SANN, variable selection is limited to the variable types required by the selected analysis type. For Cluster Analysis, two types of variables can be selected Continuous inputs (predictor) and Categorical inputs (predictor).
- In the Continuous inputs (predictors) column, select variables 2-5.
- Then click the OK button to return to the SANN - Data Selection dialog box.
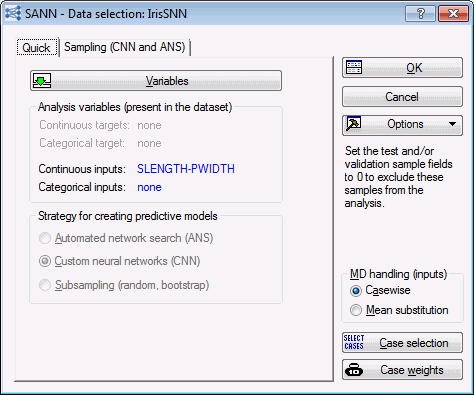
- Note that for Cluster Analysis, Custom neural networks (CNN) is the only strategy available.
- Select the Sampling (CNN and ANS) tab. The performance of a neural network is measured by the way it generalizes to unseen data (that is, how well it predicts data that was not used during training). The issue of generalization is actually one of the major concerns when training neural networks. When the training data have been overfit, it is difficult for the network to make accurate predictions using new data.
- One way to combat this problem is to split the data into two (or three) subsets: a training sample, a testing sample, and a validation sample. These samples can then be used to 1) train the network, 2) verify (or test) the performance of the training algorithms as they run, and 3) perform a final validation test to determine how well the network predicts new data.
- In SANN, the assignment of the cases to the subsets can be performed randomly or based upon a special subset variable in the data set. For this example, you can use the default settings, click the OK button to display the SANN - Custom Neural Network dialog box.
Training the network
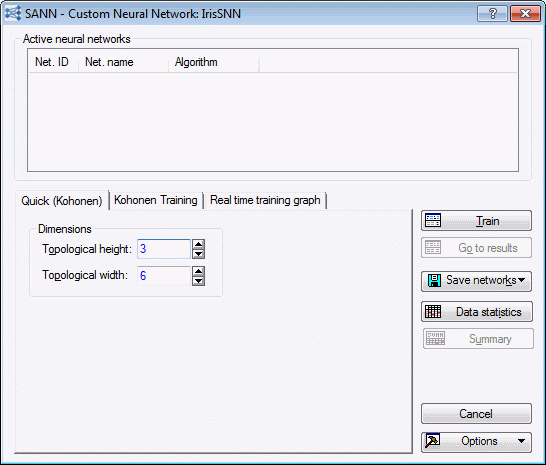
For cluster analysis, there are three tabs in the SANN - Custom Neural Network dialog box: Quick (Kohonen), Kohonen Training, and Real time training graph.
- Select the Quick (Kohonen) tab. On this tab, you can specify the dimensions of the topological map (output layer), which is laid out as a rectangular lattice.
- The dimensions specified here are used in training the network and in subsequent graphs, example, the Kohonen graph. For this example, set the Topological height to 3 and the Topological width to 6.
- Note that, depending on your future analyses, you may need to change these quantities. Determining the dimension of the topological map is an additional decision that you need to make for cluster analysis. For most problems, determining the correct numbers can require a certain amount of trial and error.
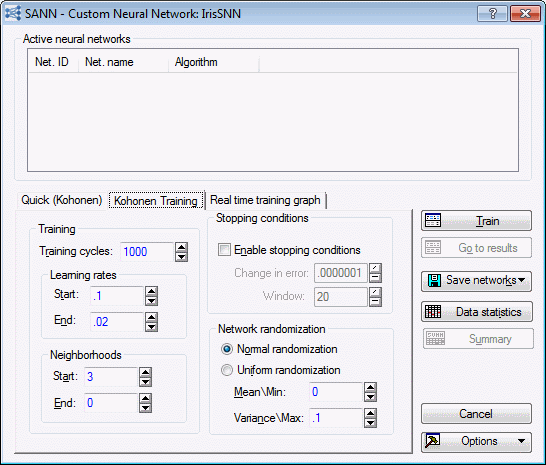
- Select the Kohonen Training tab. There are several options on this tab, but we will only examine two of them.
Neighborhoods
This is the radius of a square neighborhood centered on the winning unit. For example, a neighborhood size of 2 specifies a 5x5 square.
If the winning node is placed near or on the edge of the topological map, the neighborhood is clipped to the edge. The neighborhood is scaled linearly from the Start value to the End value given.
The neighborhood size is stored and scaled as a real number. However, for the sake of determining neighbors, the nearest integral value is taken. Thus, the actual neighborhood used decreases in a number of discrete steps. It is not uncommon to observe a sudden change in the performance of the algorithm as the neighborhood changes size. The neighborhood is specified as a real number since this gives you greater flexibility in determining when exactly the changes should occur. For this example, leave the settings at default.
Network randomization
- You can select Normal randomization or Uniform randomization.
- In addition to selecting a distribution, you must also specify the Mean\Min and Variance\Max to use.
- You can change the default mean/min and variance/max settings, but it is generally recommended that you set the mean/min to zero and variance/max no more than 0.1.
- This helps the network to gradually grow from its linear (small weight values) to nonlinear (large weight values) mode for modeling the data as and when necessary during the training process. For this example, leave these options at their default.
- The tab looka as follows:
Reviewing the results
- On the SANN - Custom Neural Network dialog box, click the Train button.
- After training, the SANN - Results dialog box is displayed.
- The Kohonen Results dialog box contains four tabs including Predictions (Kohonen), Graphs, Kohonen graph, and Custom predictions.
- As with any SANN analysis, and when applicable, you can generate results using either train, test, validation, or all samples data. In this example the train sample is used, but the steps equally apply to any sample. Note that you can specify the sample type by selecting one or more check boxes in the Sample group box of the Results dialog box.
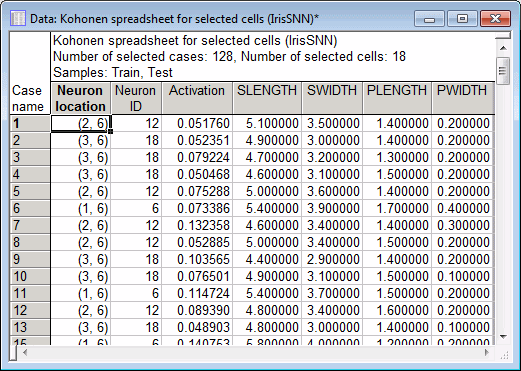
- Options on the Predictions (Kohonen) tab. Using the Predictions button, you can create a predictions spreadsheet for a specified sample. You can also include or exclude various quantities in the spreadsheet such as inputs, winning neuron position, and winning neuron activation.
- For this example, select the Winning neuron position check box and the Winning neuron activation check box.
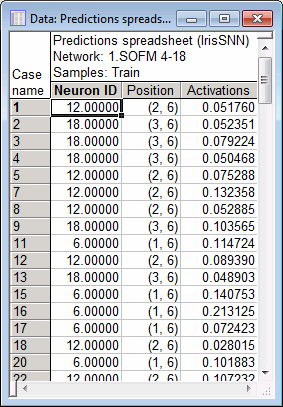
- The Kohonen map has 18 (3 x 6 = ) neurons. When a data case is passed through a Kohonen network, the position of the case (which lives in a k-dimensional space, with k being the number of the inputs of the network) is mapped onto a 2-dimensional lattice in which the Kohonen neurons are arranged. For a particular data case, the winning neuron is one that has the closest Euclidean distance to the data case. Whether a winner or not, each neuron has a position and a unique ID number. For this example (3 x 6), neuron 1 has ID (1, 1), neuron 6 is identified as (1, 6) and neuron 18 is identified as (3, 6) with 3 being the height and width of the network lattice.
- This information can be found in the Predictions spreadsheet (provided you include the Winning neuron position and activation). The spreadsheet below shows, for example, that case 1 was closest to neuron (2, 6) which has the smallest activation function (shortest Euclidean distance) to the data case.
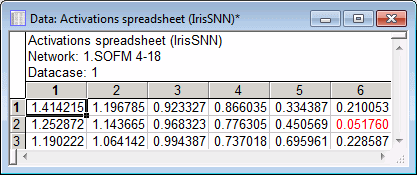
Note: You can examine the prediction of the Kohonen network on a case by case basis using the options in the Single predictions group box. Use the field to enter a data case of interest, say case 1. Then click the Activations spreadsheet button and the Activations histogram button. They both give you the activation function of the neurons with respect to the data case.
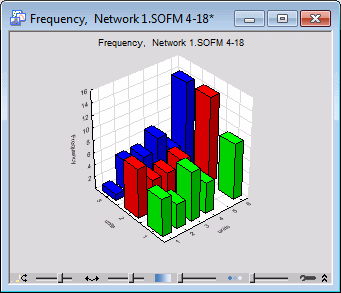
- You can also create a Frequencies spreadsheet or histogram that you can use to see how many cases belong to a particular neuron.

Interpretation of the Kohonen graph

This Topological Map window presents various pieces of information to help you make sense of the Kohonen network (SOFM) network. Each square on the tab represents a neuron in the topological lattice. As you move the mouse over the Topological Map window, a ToolTip is displayed containing the position of the neuron and the number of times it has been a winner (i.e., winning frequency). You can use the frequency to observe where on the topological map clusters have formed. The network is run on all cases in the training set (test, validation, or all samples), and a count is made of how many times each unit wins (that is, is closest to the tested case). High win frequencies indicate the centers of clusters on the topological map. Units with zero frequencies are not being used at all, and are generally regarded as an indication that learning was not very successful (as the network is not using all the resources available to it). However, in this case there are so few training cases that some unused units are inevitable.
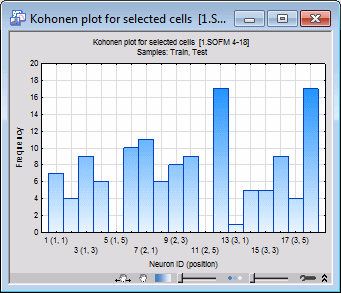
A careful examination of the spreadsheet above indicates that most of the first 50 cases that belong to category (class) Setosa actually belong to a small number of neurons namely (1, 6), (2, 6) and (3, 6). This is because Setosa is a well-localized category (that is, its inputs are clustered in a relatively small volume of the input space). This pattern, however, will dramatically change beginning from case 50 and continues until case 100 as they all belong to category Versicol, where the winning neurons are (1, 3), (1, 4), (2, 3), (2, 4), (3, 3), (3, 4) and (3, 5). A similar examination for Virginic shows that the winning neurons are (1, 1), (1, 2), (2, 1), (2, 2), (2, 3), (3, 1), (3, 2), (3, 3) and (3, 4).