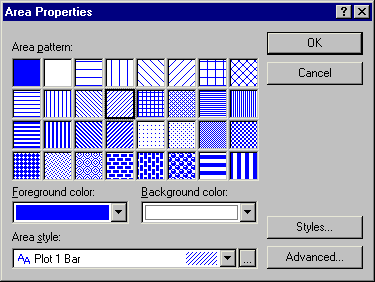
How do I specify area properties?
The quickest way to modify area properties (e.g., patterns, colors, etc.) is to right-click on the area you want to modify, and select Pattern from the shortcut menu to display the Area Properties dialog box. Use the options in this dialog box to change the area color, pattern, and style in the graph. The default patterns, colors, and modes of display of consecutive plots and other components of the graphs are determined by the selections on the Documents/Graphs: Display tab of the Options dialog box (accessible from the Tools menu). Note that the Area Properties dialog box can also be accessed from the Plot: General tab of the Graph Options dialog box.
After specifying a pattern in the Area pattern box, you can select a different color for the area Foreground (i.e., the main component or the "outside" of the item) and Background (the "inside" of the item) with these options.
Instead of specifying area patterns and color using the options described above, you can select the style you want to use for the area from the Area style box.
Support for F4. To simplify the process of editing graph display features (e.g., font color, point markers, area patterns), STATISTICA provides support for F4. This means that you can repeat the last command you performed in the graph. For example, if you have just changed the title font to Arial, 12pt, Italic and you wish to make the same change to the axis titles, simply highlight the axis title you wish to update, and press F4. Note that the F4 buffer is graph specific. If you switch to a different graph and press F4, you will repeat the last action performed on that graph.

