Special Topics Example 4 - Box-Cox Transformation of a Dependent Variable
- Overview
- This example describes the procedures involved in diagnosing the need for transformation of the dependent variable and determining the appropriate value of lambda for the Box-Cox transformation of a dependent variable. By using the Box-Cox transformation option available on the Box-Cox tab, you can easily determine the transformation from the family of power transformations that minimizes the error variability (the unpredicted variation) in the dependent variable.
- Specifying the variables and design
- Box and Draper (1987, page 205) report a study of the behavior of worsted yarn under cycles of repeated loading. (The same study is used as the basis for
Example 3: Analyzing a 3**3 Full Factorial and
Special Topics Example 3 - Residuals Analysis.) The dependent variable of interest is the number of cycles to failure. Because of large variability in that variable, a transformation of the dependent variable values were also considered. The data are contained in the data file Textile2.sta. The three factors included in the study were:
Factor Low Med High Length of specimen (mm) 250 300 350 Amplitude of load cycle (mm) 8 9 10 Load (g) 40 45 50 In this example, we will first look at the diagnostic Box-Cox transformation graph to determine the need for transformation of the dependent variable.
To begin the analysis, open the example data file Textile2.sta and start the Experimental Design module.
Ribbon bar. Select the Home tab. In the File group, click the Open arrow and from the menu, select Open Examples to display the Open a Statistica Data File dialog box. Double-click the Datasets folder, and open the Textile2.sta data set. Then, select the Statistics tab, and in the Industrial Statistics group, click DOE to display the Design & Analysis of Experiments Startup Panel.
Classic menus. On the File menu, select Open Examples to display the Open a Statistica Data File dialog box. The Textile2.sta data file is located in the Datasets folder. Then, on the Statistics - Industrial Statistics & Six Sigma submenu, select Experimental Design (DOE) to display the Design & Analysis of Experiments Startup Panel.
On the Quick tab, double-click 3**(k-p) and Box-Behnken designs to display the Design and Analysis of Experiments with Three-Level factors dialog box.
Select the Analyze design tab. Click the Variables button, and in the variable selection dialog box select Cycles and Log_Cycl as the Dependent variables, and select the three variables Length, Amplitud, and Load as the Indep (factors). Click OK in the variable selection dialog box.
Click OK in the Design & Analysis of Experiments with Three-Level Factors dialog box to display the Analysis of an Experiment with Three-Level Factors dialog box.
- Reviewing results for the untransformed dependent variable
- Box and Draper (1987) fitted the original (unlogged) dependent variable to the first degree polynomial model.
To reproduce the model coefficients reported by Box and Draper (1987, p. 214), select Cycles in the Variable drop-down list (located toward the top of the dialog box, under the Summary box).
Select the Model tab, and select the No interactions option button and select the Ignore some effects check box. Click OK in the note.
In the Customized (Pooled) Error Term dialog box, select the quadratic effects (the effects with a Q next to them) to pool them into the error term. Click OK.
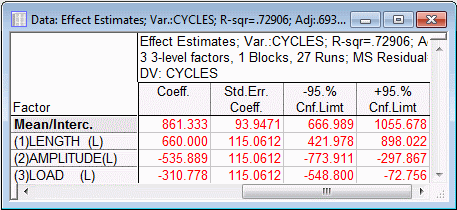
On either the Quick tab or the ANOVA/Effects tab, click the Summary: Effect estimates button to display the Effect estimates spreadsheet as we did in Special Topics Example 3 - Residuals Analysis.
Shown above are the 4 right-most columns of the spreadsheet, with the coefficients for the recoded (-1,0,1) factor values. The column of t-values (not shown in the illustration above) show that all three linear effects are highly significant.
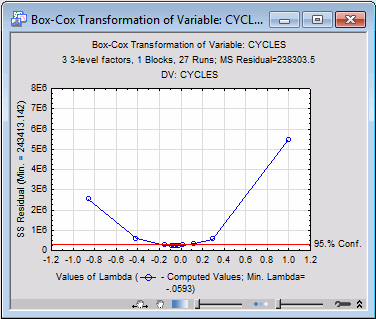
Now select the Box-Cox tab, and click the Box-Cox Transformation button. The Box-Cox transformation graph and two spreadsheets will be produced.
The graph shows the Residual sum of squares, given the model, as a function of different computed estimates of lambda, and showing the maximum likelihood estimate of lambda, which is the estimated value of lambda for which the Residual sum of squares is a minimum. The graph for this example shows that the minimum Residual sum of squares of 243413.142, occurs at a value of lambda of -.0593.
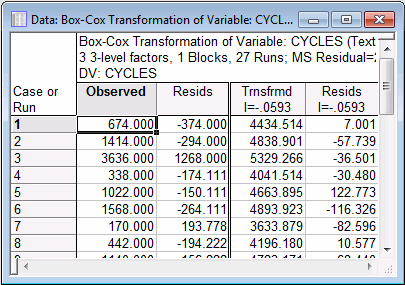
The accompanying Box-Cox Transformation spreadsheet lists the Observed values and Residuals for the dependent variable, and corresponding Transformed observed values and Transformed residuals, using the Box-Cox transformation with the maximum likelihood estimate of lambda.
The Final statistics spreadsheet lists the maximum likelihood estimate of Lambda, the SSE(1), the maximum likelihood Chi-square(1), and its associated probability, p.
The SSE(1) is the Residual sum of squares, given the model and using a single parameter, lambda, to transform the dependent variable, and the Chi-square(1) is the appropriate statistic for testing the reduction in the Residual sum of squares produced by the Box-Cox transformation with the maximum likelihood estimate of lambda (see Maddala, 1977).
The test of significance of the Chi-square(1) value therefore is a test of the need for transformation of the dependent variable. For this example, the Chi-square value of 84.08554 with 1 degree of freedom is highly significant, indicating that the Residual sum of squares is significantly reduced by using the Box-Cox transformation with a value of lambda of -.0593.
- Reviewing results for the transformed dependent variable
- In practice, it is not important that we use the exact estimated value of lambda for transforming the dependent variable. Rather, as a general rule, we should consider the following transformations:
Approximate lambda Suggested transformation of y -1 Reciprocal -0.5 Reciprocal square root 0 Natural logarithm Square root 1 None The value of lambda of -.0593 is close to 0, suggesting the appropriateness of a logarithmic transformation.
The Textile2.sta data file contains the variable called Log_Cycl, which is a logarithmic transformation of the Cycle variable.
Select Log_Cycl in the Variable drop-down list, select the Box-Cox tab, and click the Box-Cox Transformation button.
In the Final statistics spreadsheet, the Chi-square value of .941770 with 1 degree of freedom is insignificant, indicating that the Residual sum of squares is not significantly reduced by using the Box-Cox transformation of the Log_Cycl variable with a value of lambda of .628228. The logarithmic transformation of the Cycle dependent variable appears to be adequate.
- Summary
- The Box-Cox Transformation is a widely-used variance stabilizing transformation of a dependent variable. It also has the desirable property of reducing or eliminating correlation between the group means and standard deviations, which violates one of the assumptions of the ANOVA model.
For additional information regarding the power family of transformations for a dependent variable, see Box and Cox (1964), Box and Draper (1987), and Maddala (1977).
For an overview and computational details, see the Special Topic in Experimental Design - Box-Cox transformation of a dependent variable. Descriptions of procedures for examining residuals can be found in the Special Topics Example 3 - Residuals Analysis.