Example 4: Power and Sample Size in Complex Factorial ANOVA
Statistica Power Analysis includes several distribution calculators that have a wide range of potential uses. The current version of the program includes specialized dialogs for calculating power and sample size in 1-Way and 2-Way factorial analysis of variance designs. Future versions of the program may include additional specialized analyses for more complicated ANOVA designs, but suppose you need to calculate power for the test of a main effect in a 3-way 2x2x4 factorial ANOVA now. In this exercise, we show how you can calculate the power using the noncentral F distribution calculator. Our approach will allow you to compute power for any effect in a completely randomized factorial ANOVA, no matter how complicated, in a matter of a moment or two.
Calculating the Degrees of Freedom.
Ribbon bar. Select the Statistics tab. In the Advanced/Multivariate group, click Power Analysis to display the Power Analysis and Interval Estimation Startup Panel.
Classic menus. From the Statistics menu, select Power Analysis to display the Power Analysis and Interval Estimation Startup Panel.
In the Startup Panel, select Probability Distributions and Noncentral F Distribution.
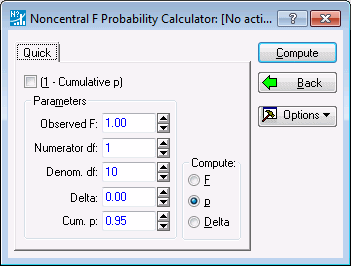
Now, click the OK button to display the Noncentral F Probability Calculator. Note that there are three parameters in a noncentral F distribution, numerator degrees of freedom, denominator degrees of freedom, and the noncentrality parameter delta.
You can obtain the degrees of freedom for your design in a number of ways. Suppose your design has p-values of factor A, q-values of factor B, and r-values of factor C. A number of ANOVA textbooks give the degrees of freedom for this design. For example, Kirk (1995) gives the degrees of freedom formulae shown in the table below.
| Source | Df |
| A | p - 1 |
| B | q - 1 |
| C | r - 1 |
| AB | (p - 1) ( q - 1) |
| AC | (p - 1) ( r - 1) |
| BC | (q - 1) ( r - 1) |
| ABC | (p - 1) (q - 1) (r - 1) |
| Within | pqr (N - 1) |
Suppose we want to compute the power for a test of the C main effect in a 2x2x4 design, when the sample size per cell is N = 8. The numerator degrees of freedom are those for the Source in the above table, while the denominator degrees of freedom in this (fixed-effects) ANOVA is always equal to those for Within. Hence the degrees of freedom for the numerator are 4 - 1 = 3, and degrees of freedom for the denominator are (2)(2)(4)(7) = 112.
- Calculating the Noncentrality Parameter
- Simple formulae for the noncentrality parameter in F- tests of significance in ANOVA are much more difficult to find than the corresponding formulae for degrees of freedom. Steiger and Fouladi (1997) give a simple formula that expresses the relationship between the RMSSE, or "root mean square standardized effect" and the noncentrality parameter
 for tests of significance in completely randomized factorial ANOVA designs. Their formula is
In this formula, dfeffect is the numerator degrees of freedom parameter for the effect being tested, and neffect is the aggregate sample size for the means being compared in the test of the particular effect. For example, consider a 3x3 analysis of variance. A test of a "row main effect" involves comparing three row means for equality. These three row means are based on sample sizes of 3N = 24 each, because they are aggregated across the three levels of the other factor. In general, when sample size per cell is equal, one computes neffect the integer resulting from the division of the total experiment size by all levels of subscript contained in that term. (If all factors are involved in the effect, neffect = N.)
In our current example of a 2x2x4 ANOVA, dfeffect = 3, and neffect = (2)(2)(8) =32.
In the present case of a three way ANOVA that has p-values of factor A, q-values of factor B, and r-values of factor C, neffect values are as given in the following table.
By simply squaring both sides and rearranging Equation 4, we have
As we saw in a previous example, an RMSSE of approximately .30 would correspond to what Cohen (1983) would call "medium effects" in this design. Using that value for RMSSE, we obtain a value for the noncentrality parameter
 of
of
(3)(32)(.03)2 = 8.64.
Completing the Power Calculation. Once values for the three parameters are available, it becomes a relatively trivial matter to compute power. The power calculation will proceed in three steps:
- Set the correct degrees of freedom.
- Calculate the critical value of F, using a noncentrality parameter of 0. Call this value Fcrit.
- Set the noncentrality parameter to the appropriate value corresponding to the effect size in the population. Compute 1 - p for Fcrit. This is the power for the ANOVA F-test
Return your attention to the Noncentral F Probability Calculator - Quick tab. Change the Numerator df to 3, and the Denom. df to 112. To calculate the critical value of F with an
 = .05, select the (1 - Cumulative p) check box, and check that 0.05 is the value for 1 - Cum. p.
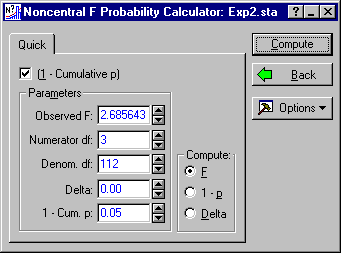
In the Compute group, select F as the quantity to compute. You are now set up to compute the critical value of the F3,112 distribution. Click the Compute button, and the critical value appears in the Observed F box.
You should observe a critical value of 2.685643. To calculate power for the F-test, we simply compute the proportion of the probability in a noncentral F3,112, 8.64 distribution. Enter 8.64 as the value for Delta, and click the 1 - p option button under Compute as the value to compute. Then click the Compute button. The dialog should then appear as below.
You have thus determined the power to be approximately .67.
In a similar vein, suppose you have a 2x3x2x4 factorial ANOVA, and wish to determine the power for the ABD interaction when the RMSSE is .3, and N =3. Denoting the levels of factors A,B,C,D as p,q,r,s, we find that the numerator degrees of freedom parameter for the ABD interaction effect is
dfABD = (p - 1)(q - 1)(s - 1) = (2 - 1)(3 - 1)(4 - 1) = 6
The denominator degrees of freedom are
dfwithin = pqrs(N - 1) = (2)(3)(2)(4)(3 - 1) = 96
The means used in computing the interaction effect are aggregated across the two levels of factor D, so we have
neffect = 2N = 6
Consequently, the noncentrality parameter is
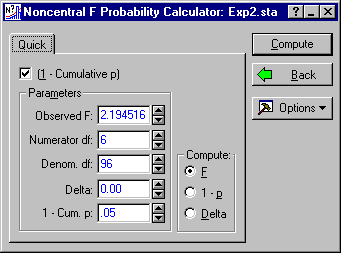
Switching to the probability calculator, we first obtain the critical value of the F-statistic, by entering the degrees of freedom (6 and 96), setting 1 - Cum. p. to .05, selecting F as the quantity to Compute, and clicking the Compute button. The result should look like this:
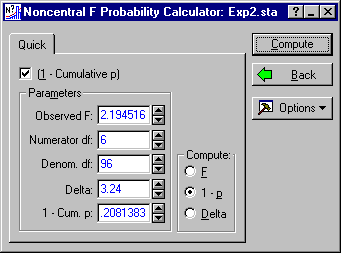
Next, compute the proportion of a noncentral F with the same degrees of freedom, but a noncentrality parameter of 3.24, that falls above the critical value just established. Simply enter 3.24 as Delta, click on the 1 - p option button to change the computed quantity, and click the Compute button. The result should look like this:
Unfortunately, the power is a meager .208, and clearly this design will not allow you to test the ABD interaction effectively with the planned sample size.
See also, Power Analysis - Index.


