QC Charts Example 5: Specifying Control Charts for Attributes, Custom Control Limits
- Overview
- In this example you will learn how to specify a control chart for attribute data and how to change control limits to custom defined values. The example is based on the Bulbs.sta data set that is located in your examples directory. You can open it via the File - Open Examples menu; it is in the Datasets folder.
Let's assume that we are manufacturing light bulbs. To evaluate whether the individual light bulbs will operate under different conditions, we drew several samples. Each sample contained 100 bulbs. Then we performed a stress test and recorded the number of defectives (non-conforming units) in a variable Defect.
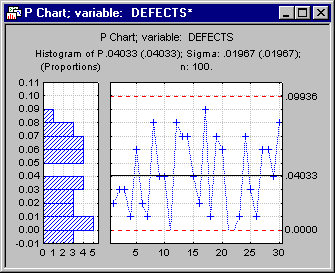
We would now like to plot the percentages of defects for the different samples in a P chart.
- Specifying the Analysis
- Select Quality Control Charts from the Statistics - Industrial Statistics & Six Sigma submenu or from the Data Mining - Process Optimization - QC Charts submenu to display the
Quality Control Charts Startup Panel. Then select P chart for attributes on the
Quick tab (or the
Attributes tab). Click the
Real-time tab and select the Auto-update option button. Now click the OK button to display the
Defining variables for attribute charts dialog.
Because we already have data in an aggregated format (i.e., each row in our data set contains the counts of defects for one sample), we can leave the default setting Counts (divide measures by sample size to compute rates or p) under Input data are counts or proportions, or raw data (with piece info).
Click the Variables button on the Quick tab and select the variable Defect as the Counts or proportions variable and click OK.
We have a constant sample size of 100. Select the Constant sample size check box and enter 100 in the field. Then click OK to produce the chart.
You will notice that there are no out-of-control samples present in our chart. If you click on the Runs tests button on the Chart tab you will notice that there seems to be a runs rules violation (from sample 20 to 22). However, we will not further investigate this problem.
- Changing Control Limits
- In the regular Shewhart control charts for variables or attributes, the control limits are usually based on the 3-Sigma calculation (where sigma denotes an estimate for the process variation). Assuming a normal distribution, this means that 99.73% of the samples will fall between the upper and lower control limit.
In the Quality Control module you can set the control limits to any user-defined specific value, regardless of the process sigma.
Note for variables control charts you could also base the calculations on the exact probability of 99.8% (European way of calculation). You would have to find the control limits that match the exact probabilities of 0.1% (lower control limit) and 99.9% (upper control limit). This means that the alpha error of erroneously declaring the process of out of control will be 0.2% instead of 0.27%.
Assuming that the process is considered to be in control and capable if the percent of defects is less than 10%, we would like to change the upper control limit (UCL) to that value.
Select the Specs tab in the Results dialog and click the UCL button to display the Control limit dialog. Select the option for Specific value, type 0.1 in the edit field, and click OK. Then click the Update button. The chart will be updated and show 0.1 as the upper control limit.
See also QC Chart Examples.


