Example 8: Power of Nonstandard Significance Tests in the Analysis of Variance
Traditionally, major hypothesis tests in the analysis of variance have been performed to assess whether main effects, interactions, or simple main effects exist at all. The traditional null hypothesis F-test is equivalent to a test that the RMSSE is equal to zero.
Many writers (see, for example, several of the chapters in Harlow, Mulaik, & Steiger, 1997) have expressed dissatisfaction with tests of the "nil hypothesis," i.e., tests that the effects are absolutely zero. One solution to this problem is to test hypotheses of "small effect" rather than hypotheses of zero effect. As examples of this strategy, consider the test of close fit and test of not-close fit proposed in structural modeling by MacCallum, Browne, and Sugawara (1996), or the tests of minimal effect discussed by Murphy and Myors (1998) in their recent, very accessible monograph on power analysis.
Testing hypotheses about close fit or minimal fit, compliments the interval estimation approach advocated by Steiger and Fouladi (1997), who suggested computing, and examining, a confidence interval on standardized effect size. The confidence interval approach allows one to test any hypothesis about effect size - simply examine whether the confidence interval excludes a given value. However, the width of the confidence interval also conveys information about the precision with which the data determine the size of the effects. Hence, noncentrality-based confidence interval estimates of effect size offer all the benefits of nonstandard hypothesis tests, and more. For an extended discussion of this point, with numerous examples, see Steiger & Fouladi (1997).
Power and sample size analysis in conjunction with hypotheses of minimal effect offers some important advantages when used in combination with the noncentrality interval estimation approach, because it assures, in advance, that precision of estimation will be sufficient to make the confidence interval usefully narrow.
In this exercise, we sketch our approach to tests of minimal effect in the analysis of variance, compare it to the approach advocated by Murphy and Myors (1998), and demonstrate how the calculations can be duplicated easily with the Noncentral F Probability Calculator.
- Relation between Measures of Effect in ANOVA
- There are several closely related measures of effect size that are employed in the context of fixed effect, factorial ANOVA designs. For notational convenience, define ∑effect as the sum of squared effects in an ANOVA. For example in a 1-Way ANOVA,
Define σeffect2, the effect variance as
where cellseffect is the number of cells involved in the effect. In a main effect, it is the number of levels in that factor. In an interaction, it is the product of the number of levels in the factors involved in the interaction.
The "signal to noise ratio" f2, is defined as
where σe2 is the error variance. The "proportion of variance accounted for by the effect, with other main effects and interactions partialled out," ω2, is given by
(For simplicity of notation, we will refer to this as ω2 in what follows.) Consequently, f and ω2 share the very simple relationships
and
The RMSSE is defined as
Hence
or
However, it is also the case that
δeffect = neffectdfeffectRMSSEeffect2 = neffectcellseffectfeffect2 (16) = neffectcellseffect(ω2 / 1 - ω2) Since RMSSE has a monotonic, functional relationship with the noncentrality parameter of the distribution of the F-statistic, so must f2 and ω2, because each of these quantities can be transformed monotonically into any of the others.
The implications of these results are that hypothesis tests on quantities like ω2 can be re-expressed as hypotheses about the noncentrality parameter δ, and vice-versa.
Suppose, for example, we want to test the hypothesis that ω2, the proportion of variance accounted for by the treatment effect, is less than or equal to .01, in a 1-way ANOVA with four groups, and a sample size of N = 25 in each group. We now address three questions concerning such a situation.
- How would one perform such a test as a hypothesis test of the noncentrality parameter δ?
- What would be the power of such a hypothesis test, if the actual value of ω2 is 0.10?
- Suppose we observe a value of 5.65 for the F-statistic in this analysis. What is the 90% confidence interval for ω2?
To answer the first question, recall that, in Example 6, we learned how to test a hypothesis about the noncentrality parameter δ. (The reader may wish to review this example briefly.) Equation 16 expresses the relation between δ and ω2.
In a 1-Way ANOVA with four groups and N = 25 in each group, the degrees of freedom are 3 and 96. neffect = 25 cellseffect = 4 and so
Hence, the hypothesis that ω2 ≤0.01 is equivalent to the hypothesis that d ≤ 1.0101. Example 6 gives a detailed discussion of how to test this hypothesis.
To answer the second question, we convert an ω2 value of 0.10 into an equivalent value of δ. We have
To compute the power, we use the Noncentral F Probability Calculator. Select Power Analysis from the Statistics menu to display the Power Analysis and Interval Estimation Startup Panel. From the Startup Panel, select Probability Distributions and Noncentral F Distribution.
Now, click the OK button to display the Noncentral F Probability Calculator.
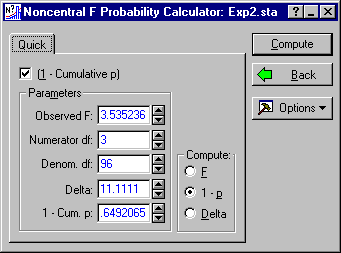
Next, compute the critical value of F for testing the hypothesis that ω2 ≤ 0.01. Enter 3 in the Numerator df box, 96 in the Denom. df box, and 1.0101 in the Delta box. Next, select the (1 - Cumulative p) check box and make sure the 1 - Cum. p value is .05. Choose F as the quantity to compute by clicking on the F option button under Compute. Finally, click the Compute button. The Observed F is the critical value of F needed to test the hypothesis that ω2 ≤0.01.
The critical value of F is 3.5352 To compute the power of the test against the alternative that ω2 = 0.10, we compute the power of the F-test when δ = 11.1111. Simply leave the Observed F value in place, and change Delta to 11.1111. Select 1 - p as the quantity to Compute, and then click the Compute button. This will compute the probability of obtaining an F-statistic greater than the Observed F when δ = 11.1111, which is the power of the test when ω2 = 0.10.
We see that the power is only .649. Hence, it seems that at this sample size, the design lacks sufficient precision to discriminate between minimal and medium size effects.
To answer the final question, we first utilize the method of Example 7 to construct a 90% confidence interval for δ, then use the results of Equation 16 to convert this confidence interval into a confidence interval for ω2.
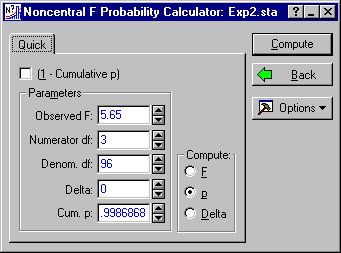
Enter the 5.65 in the Observed F box, 0 in the Delta box, and then clear the (1 - Cumulative p) check box. Next, click the Compute button to compute the cumulative probability of the observed F.
The cumulative probability is above .95, so we know that the lower limit of the confidence interval will be above zero. To compute the lower limit, we solve for a value of the noncentrality parameter that will give the observed F a cumulative probability of .95. Enter .95 as Cum. p, and select Delta under Compute. Clicking the Compute button yields 4.157486. To calculate the upper confidence limit, set Cum. p to .05, and repeat the process, obtaining an upper limit of 31.54681.
These confidence limits may be converted readily into confidence limits for ω2, by combining the results in Equations 16 and 12. Specifically, Equation 16 expresses f 2 as a function of δ. Equation 12 expresses ω2 as a function of f 2. So first, we obtain a confidence interval for f 2 from the endpoints of the confidence interval for δ. Specifically, using Equation 16, we have
In this case, neffect= 25 and cellseffect = 4, so to convert the confidence interval for δ to one for f 2, we simply divide the endpoints by 100, yielding a 90% confidence interval from .04157486 to .3154681.
Next, we convert these endpoints using Equation 12. For the lower endpoint, we have
.04157486 / 1 + .04157486 = 0.0399
For the upper endpoint, we have
.3154681 / 1 + 3154681 = 0.2398
Note how, although the observed F has a probability level of .0013, and would be termed "highly significant" by some, the percentage of variance accounted for has not been determined with a high degree of precision. The 90% confidence interval for ω2 ranges from about 4% to about 24%.
See also, Power Analysis - Index.