Extra Objects in Compound Graphs
Compound graphs are those that consist of more than one graph and/or graph type in a single display, such as:
- Categorized plots (categorized by one or two variables)
- Matrix plots, such as matrix scatterplots, line plots, etc.
- Scatterplots with box-whiskers or histograms
For these types of graphs, additional options exist to precisely control the location ("anchor point") where an extra graph object (e.g., text, arrow, polyline, etc.) is to be attached. Note that different types of dialogs will be displayed depending on the type of compound graph to which you are attaching an object, as well as the type of object that is to be attached. Some objects require more than one attachment point (e.g., arrows, which point from an anchored location to a second anchored location), and for these objects, the controls described here are repeated for each attachment point.
Options for Categorized Plots
In categorized graphs, you can attach extra objects to the Main graph or to one of the Subgraphs (categories of the categorized graph). These options work in conjunction with the dynamic vs. static Anchoring Objects to Coordinates.
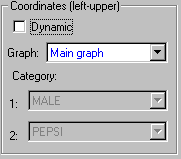
- Dynamic
- Select this check box to attach the object dynamically to one of the plots, and to one of the categories in the categorized graph. When this check box is not selected, you can attach (statically) either to the Main graph, or to one of the Subgraphs (i.e., categories of the categorized graph).
- Graph
- If the Dynamic check box is selected, you can select to attach the object to one of the plots, e.g., to Plot 1 in a simple categorized scatterplot; in addition, specify the category (subgraph) to which to attach the object. When the Dynamic check box is not selected, you can either attach the object to the Main graph or you can attach the object to a Subgraph; if Subgraph is selected, specify in the Category boxes to which Subgraph (sub-category of the categorized graph) to attach.
- Category
- Specify here the category of the categorized graph, and hence the Subgraph of the categorized graph to which to attach the object. These options are only available if you chose to attach to a Subgraph; these options are not available if you chose to attach statically (non-Dynamically) to the Main graph.
Options for Matrix Plots
In Matrix plots, you can attach extra objects to the Main graph, or to one of the Subgraphs (individual graph in the matrix of graphs). These options work in conjunction with the dynamic vs. static Anchoring Objects to Coordinates.
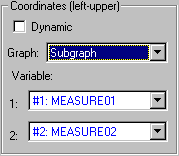
- Dynamic
- Select this check box to attach the object dynamically to one of the plots and to one of the individual graphs in the matrix of graphs. When this check box is not selected, you can attach (statically) either to the Main graph, or to one of the Subgraphs (i.e., categories of the categorized graph). For example, in Matrix scatterplots, you can dynamically or statically attach to one of the individual scatterplots or to one of the histograms on the diagonal of square matrix plots.
- Graph
- If the Dynamic check box is selected, you can select to attach the object to one of the plots, e.g., to Plot 1 in matrix scatterplots to attach to one of the scatterplots, or to Plot 2 to attach to one of the histograms in the matrix scatterplots. In addition, you need to specify the subgraph (e.g., pair of variables) to which to attach the object. When the Dynamic check box is not selected, you can either attach the object to the Main graph or you can attach the object to a Subgraph; if Subgraph is selected, specify in the Variable boxes to which subgraph to attach.
- Variable
- Specify here the variable(s) of the matrix plot, and hence the Subgraph to which to attach the object. These options are only available if you chose to attach to a Subgraph; these options are not available if you chose to attach statically (non-Dynamically) to the Main graph. Note that only a single variable selection is available if you attach to histograms (Plot 2) in matrix scatterplots.
Options for Scatterplots with Box-Plots or Histograms
In Scatterplots with Box-Plots or Scatterplots with Histograms, you can attach extra objects to the Main graph,or to one of the Subgraphs (e.g., histograms, or the scatterplot in the center). These options work in conjunction with the dynamic vs. static Anchoring Objects to Coordinates.
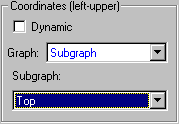
- Dynamic
- Select this check box to attach the object dynamically to one of the plots and to one of the individual graphs. When this check box is not selected, you can attach (statically) either to the Main graph, or to one of the Subgraphs. For example, in Scatterplots with histograms, you can dynamically or statically attach to the Scatterplot, or to one of the histograms at the Top (for the x-variable) or to the Right (for the y-variable).
- Graph
- If the Dynamic check box is selected, you can select to attach the object to one of the plots, e.g., to the Scatterplot in Scatterplots with histograms, or to the histograms at the Top or to the Right of the scatterplot.


