Example 1: A Simple Custom Chart Event Handler
Before proceeding with the examples, you may want to review the section on Events in the general documentation for STATISTICA Visual Basic. The logic of specifying and working with custom event handlers (SVB programs) in Quality Control is very similar.
Suppose you want to display a custom message box every time that the control chart updates. Start by creating, for example, an X-bar and R chart. Make sure that you select the real time mode on the Real Time tab of the Quality Control Charts - Startup Panel. Otherwise, the chart will not respond to changes in the data, i.e., to "live" data streams.
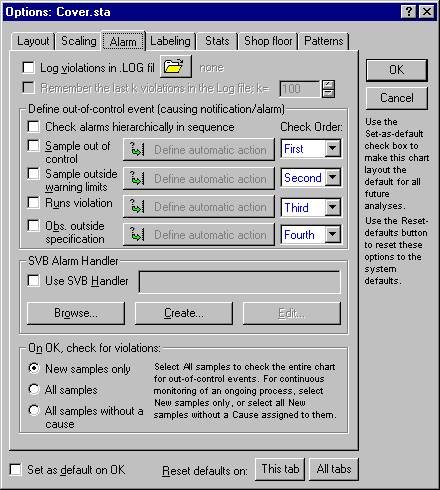
On the Results dialog, click the Options button to display the chart Options dialog; select the Alarm tab.
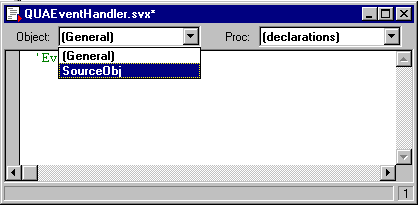
Next click the Create button to create a new event (alarm) handler, and select a data file name. A standard Visual Basic editor window will be displayed. Call the new program QUAEventHandler.svx.
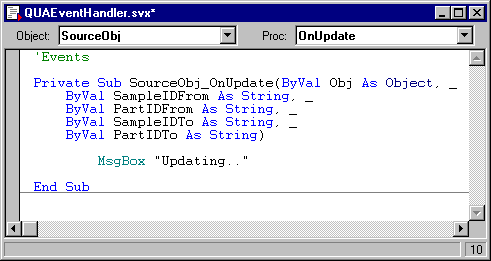
Next make sure that you set the Object to the SourceObj, as shown above, to "expose" the different events available for the chart; these can be reviewed in the Proc: field.
Select the OnUpdate event, and the "signature" (header) for that event is automatically transferred to the editor.
In the illustration, we have already typed in the code to produce a message box. Now save the event handler.
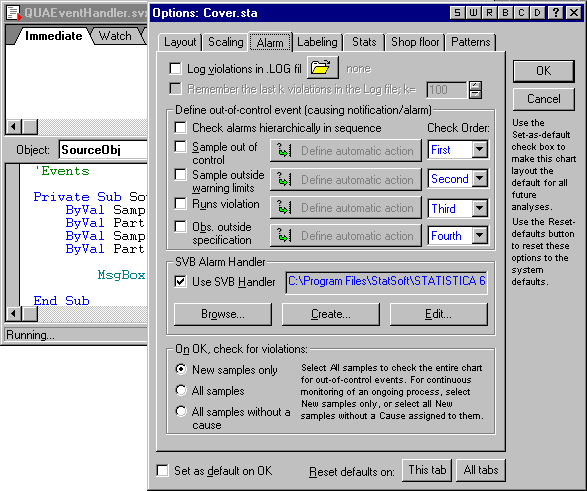
Next, display the Alarm tab of the chart Options dialog again, and "connect" the event handler by selecting the Use SVB Handler checkbox.
Close the Options dialog, and the update event handler is now connected to the chart. To "fire" the event handler, and to display the message box with the "Updating..." message, change any value for the charted variable in the input file. This will cause the chart to (auto-) update, and this event to fire.


