Example 8: MSA Attribute Data
Ribbon Bar. Select the Home tab. In the File group, click the Open arrow and on the menu, select Open Examples to display the Open a Statistica Data File dialog box. Open the MSA_Attribute.sta data file, which is located in the Datasets folder.
Classic menus. On the File menu, select Open Examples to display the Open a Statistica Data File dialog box. Open the MSA_Attribute.sta data file, which is located in the Datasets folder.
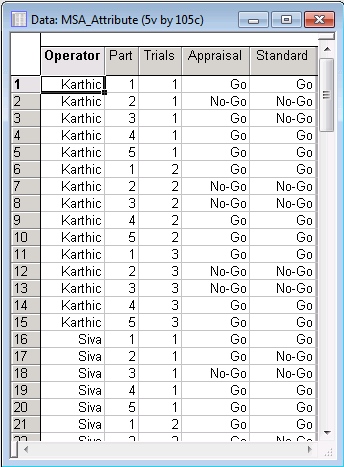
The fictional data set contains appraisals from 7 newly hired operators at a production facility. They have just received training on how to determine whether a product is considered good or bad. The plant manager asked each operator to judge 1 of 5 parts for 3 trials. Their response was either Go (Accept) or No-Go (Reject). Their responses will be compared to the known standard to determine their effectiveness and whether more training is needed.
- Specifying the analysis
- Start the Process Analysis module:
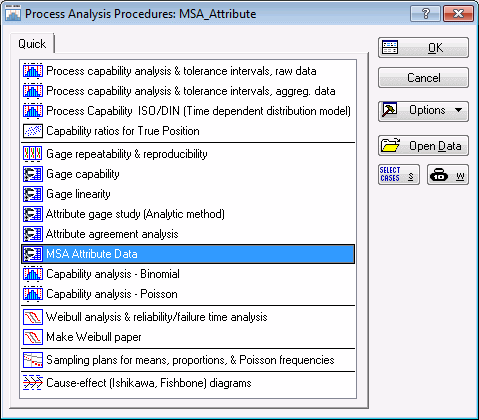
Ribbon bar. Select the Statistics tab. In the Industrial Statistics group, click Process Analysis to display the Process Analysis Procedures Startup Panel.
Classic menus. On the Statistics - Industrial Statistics & Six Sigma submenu, select Process Analysis to display the Process Analysis Procedures Startup Panel.
Select MSA Attribute Data.
Click the OK button to display the MSA Attribute data dialog box (you can also double-click on MSA Attribute Data to display this dialog box).
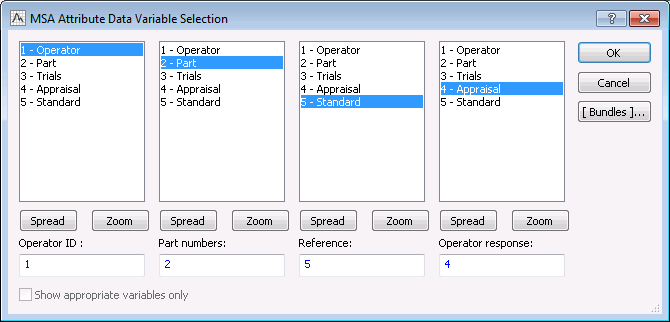
The Single column (Stacked data) option button is selected by default. Click the Variables button under this option to display the MSA Attribute Data Variable Selection dialog box.
In the Operator ID column, select Operator; in the Part numbers column, select Part; in the Reference column, select Standard; and in the Operator response column, select Appraisal.
Click OK in the MSA Attribute Data Variable Selection dialog box.
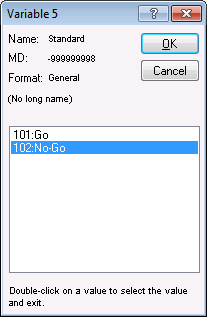
Next, double-click in the Code for accept responses field to display the Variable Code dialog box for Variable 5, and select Go.
Click OK in this dialog box to accept the selection, close the dialog box, and return to the MSA Attribute data dialog box.
Next, double-click in the Code for reject responses field to display the Variable Code dialog box for Variable 5, and select No-Go.
Click OK in this dialog box to accept the selection, close the dialog box, and return to the MSA Attribute data dialog box.
Select the Acceptance options tab to display the options for defining acceptable/unacceptable Effectiveness, P(FR), P(FA), and Bias. For this example, we will leave all the options at their defaults.
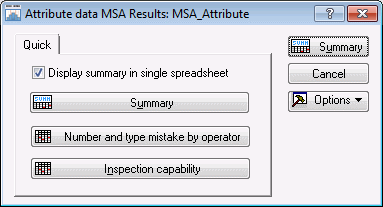
Click OK in the MSA Attribute data dialog box to display the Attribute data MSA Results dialog box.
- Reviewing the results
- Note that the
Display summary in single spreadsheet check box is selected by default. This option specifies that all of the results tables will be output in one spreadsheet. Click the
Summary button to produce the results.
Following is a portion of the table, which displays the crosstabulation between type of mistake and operator as well as each judge’s effectiveness, probability of false rejection, probability of false acceptance, and overall bias.
- Summary
- From this analysis, the plant manager has learned that, surprisingly, most of the new employees will require further training. Sachin is the only new employee that judged each part correctly over the three trials. Karthic performed well except for 1 false acceptance. See MSA Attribute Data Overview for further details.

