MQC Charts Example 2 - Creating a MEWMA Chart for Individuals
- Overview
- This example is based on the data file ThreeQualityCharacteristics.sta. The data contains three quality characteristics for a certain product measured at regular time intervals for monitoring and quality control.
The Multivariate Exponentially Moving Average (MEWMA) Chart is a multivariate generalization of the univariate EWMA chart (see Lowry, Woodall, Champ, and Rigdon, 1992). Instead of "tracking" the exponentially weighted moving average for a single variable (see Quality Control), the chart is constructed from vectors of multiple exponentially weighted moving averages. The test statistic computed for the chart (i.e., the plot points on the chart) is also the Hotelling T2 statistic. It is more sensitive to small shifts than the Hotelling T2 chart.
Specifying the analysis.
- Ribbon bar
- Open the data file by selecting the Home tab. In the File group, click the Open arrow and select Open Examples to display the Open a Statistica Data File dialog. The data file is located in the Datasets folder.
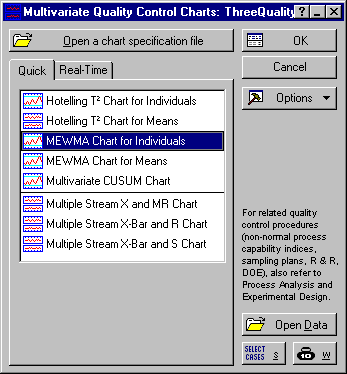
Then, select the Statistics tab. In the Industrial Statistics group, click Multivariate to display the Multivariate Quality Control Charts Startup Panel.
- Classic menus
- Open the data file by selecting Open Examples from the File menu to display the Open a Statistica Data File dialog. The data file is located in the Datasets folder.
Then, from the Statistics - Industrial Statistics & Six Sigma submenu, select Multivariate Quality Control to display the Multivariate Quality Control Charts Startup Panel.
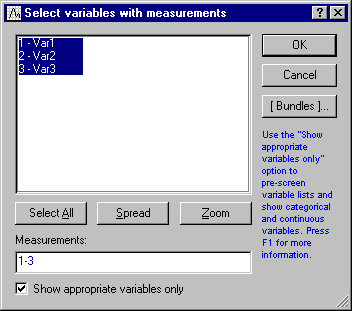
Select MEWMA Chart for Individuals on the Quick tab. Click the OK button to display the Defining Variables for MEWMA(Individuals) Chart dialog. On the Quick tab, click the Variables button and select variables 1-3.
Click the OK button to close the variable selection dialog. Next, in the Defining Variables for MEWMA(Individuals) Chart dialog, select the Advanced tab and specify Sample Covariance Matrix as the method of estimating the covariance matrix. Click OK to run the analysis.
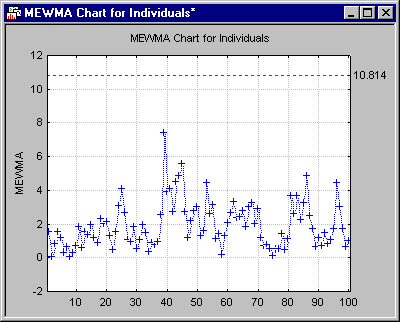
The MEWMA Chart for Individuals will be displayed, as well as the Results dialog.
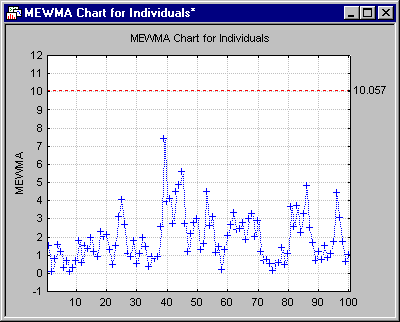
Since all data points fall below the control limit, variation in the data is attributable to common causes. To change the control limit, in the Results dialog, select the X(Multivariate) tab and click the UCL button to display the Upper Control Limit dialog. For this example, change the Average run length (ARL) to 150.
Click OK to accept the changes, close this dialog and return to the Results dialog. The control limit for the chart has been updated based upon the ARL.
Select the Charts tab, and click the Charts button.


