ITrees Extended Options
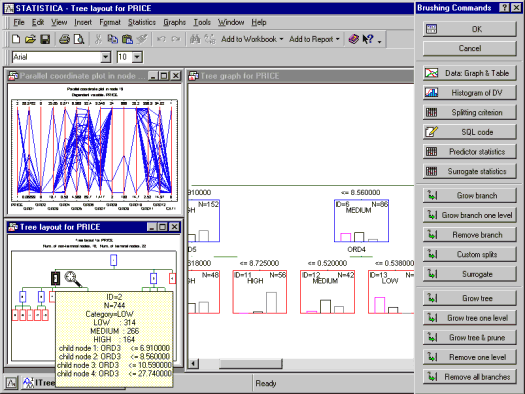
Click the OK button in the Interactive Trees Startup Panel to display the Interactive Trees specifications dialog box. The name of the dialog box will be either ITrees C&RT Extended Options or ITrees CHAID Extended Options. The specific options and tabs available in this dialog box depend on the Type of analysis and Model building method selected on the Startup Panel.
| Element Name | Description |
|---|---|
| OK | Click the OK button to begin the analysis and to display the Itrees Results dialog box. By default, STATISTICA will simply read the data and display a single root node. However, if V-fold cross-validation is selected on the Validation tab, the program will automatically build the best tree (given the current Model building method and specifications for stopping and pruning) and compute risk estimates based on the v-fold cross-validation samples. |
| Cancel | Click the Cancel button to close the dialog box without performing an analysis. |
| Options | Click the Options button to display the Options menu. |
| Select Cases | Click the Select Cases button to display the Analysis/Graph Case Selection Conditions dialog box, which is used to create conditions for which cases will be included (or excluded) in the current analysis. More information is available in the case selection conditions overview, syntax summary, and dialog description. |
| W | Click the W (Weight) button to display the Analysis/Graph Case Weights dialog box, which is used to adjust the contribution of individual cases to the outcome of the current analysis by "weighting" those cases in proportion to the values of a selected variable. |
| Auto-update results | Select this check box to create the results spreadsheets and graphs as stand-alone windows that will be updated in place as you update the respective results for particular nodes, or after growing or pruning the tree. For example, you may display the predictor statistics for a particular node, then highlight another node and select the Predictor statistics option again to update the predictor statistics in the (same) results table. This option is useful when you have a relatively large computer screen that enables you to arrange the most important output (results spreadsheets and graphs) in particular locations on the screen to be updated as you interactively build the tree.
If the Auto-update results check box is not selected, all results will be displayed in workbooks, stand-alone windows, or reports, depending on the options selected in the Analysis/Graph Output Manager dialog box. |
Copyright © 2021. Cloud Software Group, Inc. All Rights Reserved.

