Example 10: Chi-Square Test for Independence
The goal of this example is to determine the relationship between two categorical variables. We want to know if these two categorical variables are independent. If not, we will further explore the relationship between them.
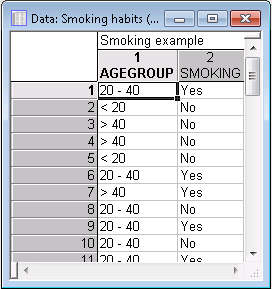
For this example, the Smoking habits.sta data set, included with the Statistica examples, is used. In this data, observations were recorded from 50 people about their age and whether they smoke cigarettes. With this study, we want to answer the question, "does a significant relationship exist between a person’s age category and smoking?" The null hypothesis is that the variables AGEGROUP and SMOKING are independent. A chi-square test for independence will help to answer this question. A partial view of the data is shown in the next image.
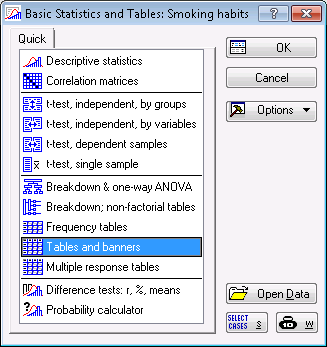
Open the data file Smoking habits.sta and start the Basic Statistics module. Following are instructions to do this from the ribbon bar and from the classic menus:
Ribbon bar. Select the Home tab. In the File group, click the Open arrow and select Open Examples to display the Open a Statistica Data File dialog box. Smoking habits.sta is in the Datasets folder.
On the Statistics tab, in the Base group, click Basic Statistics to display the Basic Statistics and Tables dialog box.
Classic menus. From the File menu, select Open Examples to display the Open a Statistica Data File dialog box. The data file is located in the Datasets folder.
From the Statistics menu, select Basic Statistics/Tables to display the Basic Statistics and Tables dialog box.
On the Quick tab, select Tables and banners.
Click the OK button to display the Crosstabulation Tables dialog box.
Click the Specify tables (select variables) button to display a variable selection dialog box. Select AGEGROUP in List1 and SMOKING in List2 as shown in the next image.
Click OK in the variable selection dialog box.
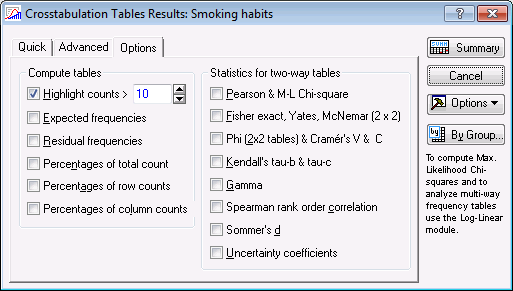
Click OK in the Crosstabulation Tables dialog box to display the Crosstabulation Tables Results dialog box. Select the Options tab.
This tab contains several statistics options from which to choose for two-way tables. For this example, we will use the Pearson Chi-Square test for Independence. In the Statistics for two-way tables group box, select the Pearson & M_L Chi-square check box.
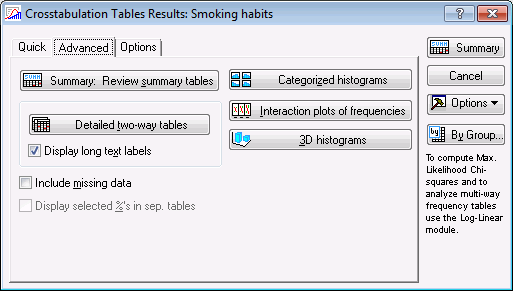
To create the output, select the Advanced tab.
Click the Detailed two-way tables button to create the 2-Way Summary Table and a separate output spreadsheet containing the Pearson Chi-Square and Maximum Likelihood Chi-Square tests.
The Pearson Chi-square test is 4.065393 with a p-value of 0.13098. Because the p-value is greater than alpha = 0.05, the null hypothesis (Smoking and Age category are independent) is not rejected. This can be interpreted by saying that a significant relationship does not exist between a person’s smoking status and age category.
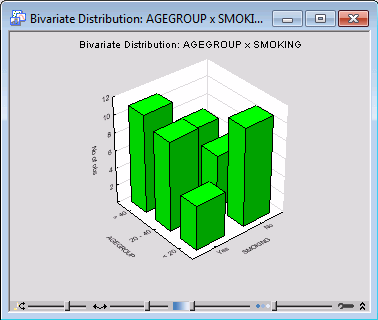
To further explore this relationship, in the Crosstabulation Tables Results dialog box, click the 3D histograms button. A bivariate histogram shows the frequencies broken down across the categories of the two variables. Although some relationship appears to exist in the plot, namely that the age category < 20 has fewer smokers than non-smokers, which is opposite of the relationship in the other two categories, the statistical test did not detect a relationship.

