Conceptual Overviews - 3D Range and Box Plots
Similar to 2D Range Plots and to 2D Box plots, 3D range and 3D box plots display ranges of values or error bars related to specific measures of central tendency, but the results are displayed in three dimensions, which may produce a more attractive presentation effect and sometimes increases the readability (and informativeness) of the display, especially when the appropriate viewpoint is selected.

Applications
The typical applications for both range and box plots are the same (they differ only in terms of the source of data: existing (i.e., already calculated) values for central tendencies and ranges vs. values calculated by the graphing procedure directly from raw data). In general, these graphs are used to display (a) ranges of values for individual units of analysis (items, cases, samples, etc.) or (b) variation of scores in individual groups or samples.
Graph Type
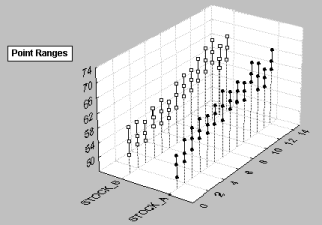
Statistica offers a unique selection of 3D Range Plots and 3D Box Plots (illustrated below). When the Point Ranges style is used, the ranges are represented by point markers (connected by a line). One range is plotted for each case.

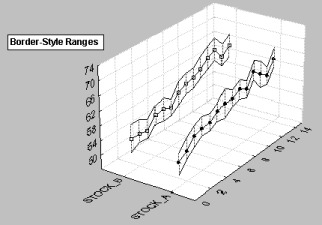
When Border-style Ranges are plotted, the ranges are represented by two continuous lines (upper and lower ranges). The mid-points are represented by point markers connected with a line.

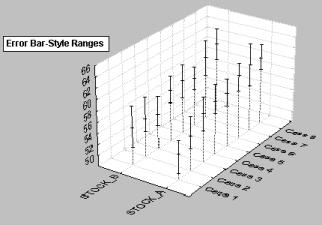
For Error Bar-style Ranges, the mid-points are represented by point markers, and the ranges are represented by error bars. One error bar is plotted for each case.

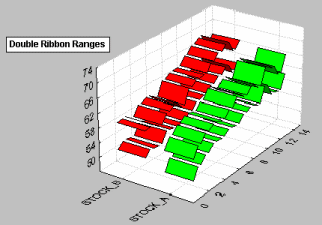
When Double Ribbon Ranges are plotted, the ranges are represented by two ribbons (upper and lower ranges).

For Flying Boxes, the ranges are represented by "flying" boxes,

and for Flying Blocks, the ranges are represented by "flying" blocks.

For the last three graph types (i.e., Double Ribbon Ranges, Flying Boxes, and Flying Blocks), the mid-points are not displayed in the graph (they can be shown when you switch to one of the first three types of range plots).
