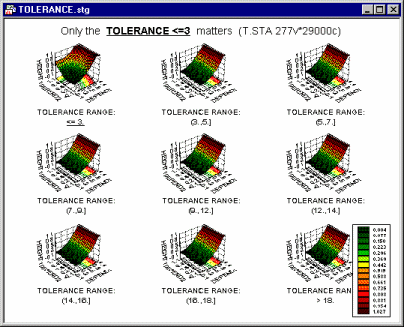
What are categorized graphs?
Categorized graphs are created by categorizing data into subsets and then displaying each of these subsets in a separate small component graph arranged in one display. For example, one graph can represent male subjects and another one female subjects, or high blood pressure females, low blood pressure females, high blood pressure males, etc.
In STATISTICA, categorized graphs are:
• available in many output dialogs (they are automatically generated as part of output from all procedures that analyze groups or subsets of data, e.g., breakdowns, t-tests, ANOVA, discriminant function analysis, nonparametrics, and many others),
• accessible as part of the Graphs of Input Data options in the shortcut menus in all spreadsheets, and
• accessible from the Graphs menu where a wide variety of user-defined methods to categorize data are available.
See also, Methods of Categorization and Conceptual Overviews - What Are Categorized Graphs?.

