Conceptual Overviews - What Are Categorized Graphs?
Categorized graphs (also called casement plots, Chambers, et al., 1983) produce a series of 2D or 3D graphs (such as histograms, scatterplots, line plots, surface plots, etc.), one for each selected category of cases (i.e., subset of cases), for example, respondents from New York, Chicago, Dallas, etc. These "component" graphs are placed sequentially in one display, allowing for comparisons between the patterns of data shown in graphs for each of the requested groups (e.g., cities).
A variety of options is offered for selecting the subsets; the simplest of them is using a categorical variable (e.g., a variable City, with three values New York, Chicago, and Dallas). For example, the following graph shows histograms of a variable representing self-reported stress levels in each of the three cities.

You could conclude that the data suggest that people live in Dallas are less likely to report being stressed, while the patterns (distributions) of stress reporting in New York and Chicago are quite similar.
Categorized graphs in STATISTICA also support two-way categorizations, where not one criterion (e.g., City) but two criteria (e.g., City and Time of the day) are used to create the subsets. Two-way categorized graphs can be thought of as "crosstabulations of graphs" where each component graph represents a cross-section of one level of one grouping variable (e.g., City) and one level of the other grouping variable (e.g., Time).
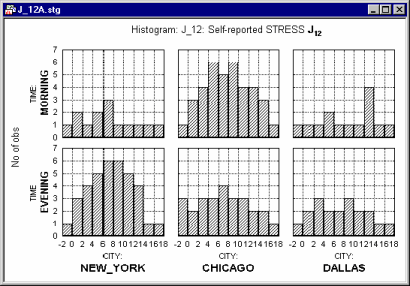
Adding this second factor reveals that the patterns of stress reporting in New York and Chicago are actually quite different when the Time of questioning is taken into consideration, whereas the Time factor makes little difference in Dallas.
- Categorized graphs vs. matrix graphs.
- Matrix graphs also produce displays containing multiple component graphs; however, each of those component graphs are (or can be) based on the same set of cases and the graphs are generated for all combinations of variables from one or two lists. Categorized graphs require a selection of variables that normally would be selected for non-categorized graphs of the respective type (e.g., two variables for a scatterplot). However, in categorized plots, you also need to specify at least one grouping variable that contains information on group membership of each case (e.g., Chicago, Dallas). That grouping variable will not be included in the graph directly (i.e., it will not be plotted) but it will serve as a criterion for dividing all analyzed cases into separate graphs. As illustrated above, one graph will be created for each group (category) identified by the grouping variable.